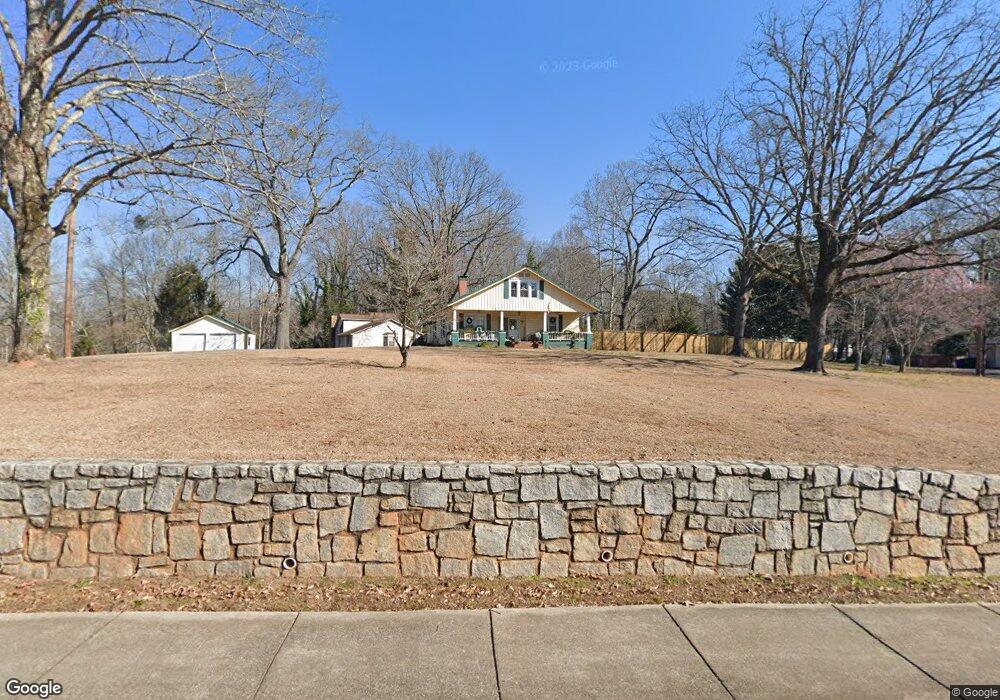
1330 Clay Rd SW Mableton, GA 30126
Estimated Value: $369,000 - $417,000
3
Beds
3
Baths
2,567
Sq Ft
$150/Sq Ft
Est. Value
About This Home
This home is located at 1330 Clay Rd SW, Mableton, GA 30126 and is currently estimated at $385,654, approximately $150 per square foot. 1330 Clay Rd SW is a home located in Cobb County with nearby schools including Deerwood Elementary School, Mableton Elementary School, and Floyd Middle School.
Ownership History
Date
Name
Owned For
Owner Type
Purchase Details
Closed on
Dec 20, 2004
Sold by
Ebert Chris S and Ebert Lana
Bought by
Straw Kristen T
Current Estimated Value
Home Financials for this Owner
Home Financials are based on the most recent Mortgage that was taken out on this home.
Original Mortgage
$127,800
Outstanding Balance
$63,266
Interest Rate
5.66%
Mortgage Type
New Conventional
Estimated Equity
$322,388
Purchase Details
Closed on
Aug 22, 2001
Sold by
Vance Douglas E
Bought by
Ebert Chris S and Ebert Lana S
Purchase Details
Closed on
Sep 1, 1993
Sold by
Gee Donald R Joan E
Bought by
Vance Douglas E Teressa
Home Financials for this Owner
Home Financials are based on the most recent Mortgage that was taken out on this home.
Original Mortgage
$99,100
Interest Rate
10%
Mortgage Type
FHA
Create a Home Valuation Report for This Property
The Home Valuation Report is an in-depth analysis detailing your home's value as well as a comparison with similar homes in the area
Home Values in the Area
Average Home Value in this Area
Purchase History
| Date | Buyer | Sale Price | Title Company |
|---|---|---|---|
| Straw Kristen T | $159,800 | -- | |
| Ebert Chris S | $128,000 | -- | |
| Vance Douglas E Teressa | $19,000 | -- |
Source: Public Records
Mortgage History
| Date | Status | Borrower | Loan Amount |
|---|---|---|---|
| Open | Straw Kristen T | $127,800 | |
| Previous Owner | Vance Douglas E Teressa | $99,100 | |
| Closed | Vance Douglas E Teressa | $2,000 |
Source: Public Records
Tax History Compared to Growth
Tax History
| Year | Tax Paid | Tax Assessment Tax Assessment Total Assessment is a certain percentage of the fair market value that is determined by local assessors to be the total taxable value of land and additions on the property. | Land | Improvement |
|---|---|---|---|---|
| 2025 | $2,816 | $122,276 | $44,460 | $77,816 |
| 2024 | $2,818 | $122,276 | $44,460 | $77,816 |
| 2023 | $1,891 | $104,536 | $49,140 | $55,396 |
| 2022 | $2,076 | $87,352 | $42,120 | $45,232 |
| 2021 | $1,971 | $82,536 | $39,780 | $42,756 |
| 2020 | $1,766 | $73,176 | $30,420 | $42,756 |
| 2019 | $1,766 | $73,176 | $30,420 | $42,756 |
| 2018 | $1,391 | $56,064 | $16,380 | $39,684 |
| 2017 | $1,326 | $56,064 | $16,380 | $39,684 |
| 2016 | $1,235 | $51,872 | $14,040 | $37,832 |
| 2015 | $1,268 | $51,908 | $14,040 | $37,868 |
| 2014 | $1,279 | $51,908 | $0 | $0 |
Source: Public Records
Map
Nearby Homes
- 1275 Clay Rd SW
- 0 Brookwood Dr Unit 7577066
- 0 Brookwood Dr Unit 10519191
- 1440 Compton Dr SW
- 1056 Retner Dr SW Unit 3
- 1047 Retner Dr SW
- 4976 Mable Lake Dr SW
- 4397 Treadle Rd SW
- 1675 Huntcrest Park SW
- 4556 Sweetlake Rd SW
- 1645 Fulmont Cir
- 4690 Glore Rd SW
- 8009 Haven Springs Trace
- 8029 Haven Springs Trace
- 8025 Haven Springs Trace
- 8041 Haven Springs Trace
- Laurel Plan at Avenbrook
- Rosedale Plan at Avenbrook
- 5015 Brookwood Dr SW
- 1310 Clay Rd SW
- 1335 Clay Rd SW
- 1325 Clay Rd SW
- 5040 Brookwood Dr SW
- 5025 Brookwood Dr SW
- 1315 Clay Rd SW
- 1290 Clay Rd SW
- 5080 Brookwood Dr SW
- 1305 Clay Rd SW
- 5020 Brookwood Dr SW
- 1375 Clay Rd SW
- 1370 Clay Rd SW
- 5101 Brookwood Dr SW
- 5024 Glore Rd SW
- 5060 Glore Rd SW
- 5003 Brookwood Dr SW
- 5012 Brookwood Dr SW
- 1289 Clay Rd SW
- 1307 Lavista Dr SW