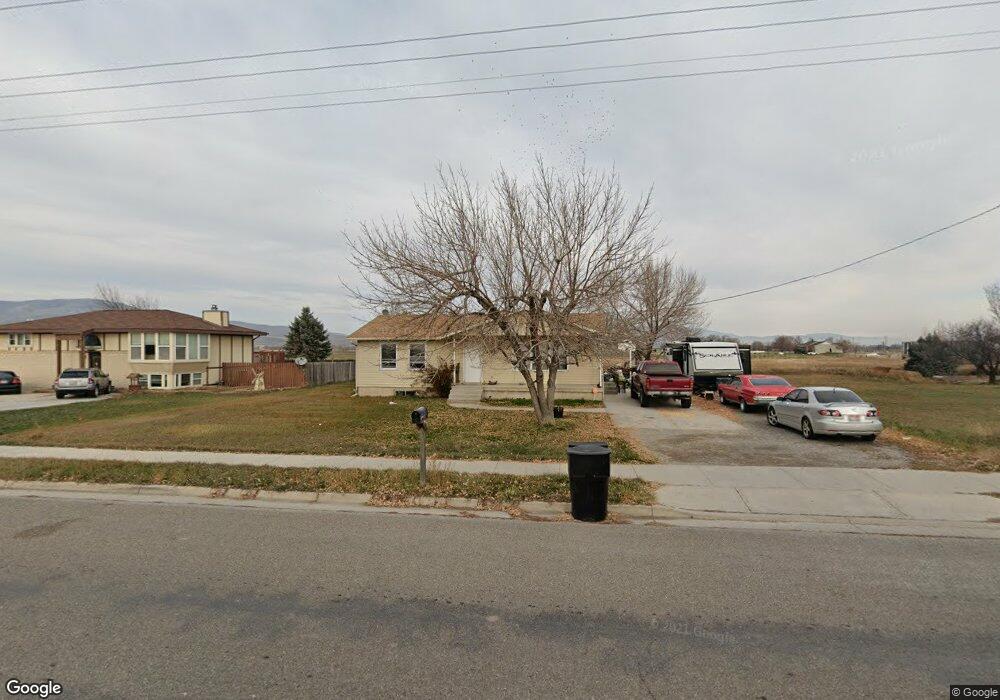
1330 E 1400 S Garland, UT 84312
Estimated Value: $356,000 - $391,000
4
Beds
2
Baths
2,168
Sq Ft
$173/Sq Ft
Est. Value
About This Home
This home is located at 1330 E 1400 S, Garland, UT 84312 and is currently estimated at $374,795, approximately $172 per square foot. 1330 E 1400 S is a home located in Box Elder County with nearby schools including Garland School, Bear River Middle School, and Alice C. Harris Intermediate School.
Ownership History
Date
Name
Owned For
Owner Type
Purchase Details
Closed on
Oct 16, 2006
Sold by
Tapia Melissa
Bought by
Tapia Melissa and Tapia Daniel P
Current Estimated Value
Home Financials for this Owner
Home Financials are based on the most recent Mortgage that was taken out on this home.
Original Mortgage
$114,900
Outstanding Balance
$68,297
Interest Rate
6.39%
Mortgage Type
New Conventional
Estimated Equity
$306,498
Purchase Details
Closed on
Oct 11, 2006
Sold by
Federal National Mortgage Association
Bought by
Tapia Melissa
Home Financials for this Owner
Home Financials are based on the most recent Mortgage that was taken out on this home.
Original Mortgage
$114,900
Outstanding Balance
$68,297
Interest Rate
6.39%
Mortgage Type
New Conventional
Estimated Equity
$306,498
Purchase Details
Closed on
Mar 31, 2006
Sold by
Weatherston Gary L and Weatherston Starlene
Bought by
Federal National Mortgage Association
Create a Home Valuation Report for This Property
The Home Valuation Report is an in-depth analysis detailing your home's value as well as a comparison with similar homes in the area
Home Values in the Area
Average Home Value in this Area
Purchase History
We collect this data history from publicly available records. To have your information removed, we recommend requesting removal directly through your county’s website.
| Date | Buyer | Sale Price | Title Company |
|---|---|---|---|
| Tapia Melissa | -- | None Available | |
| Tapia Melissa | $114,900 | Us Title | |
| Federal National Mortgage Association | $74,329 | None Available |
Source: Public Records
Mortgage History
We collect this data history from publicly available records. To have your information removed, we recommend requesting removal directly through your county’s website.
| Date | Status | Borrower | Loan Amount |
|---|---|---|---|
| Open | Tapia Melissa | $114,900 | |
| Closed | Tapia Melissa | $114,900 |
Source: Public Records
Tax History
| Year | Tax Paid | Tax Assessment Tax Assessment Total Assessment is a certain percentage of the fair market value that is determined by local assessors to be the total taxable value of land and additions on the property. | Land | Improvement |
|---|---|---|---|---|
| 2025 | $2,092 | $325,087 | $105,000 | $220,087 |
| 2024 | $1,815 | $318,260 | $100,000 | $218,260 |
| 2023 | $1,838 | $317,744 | $90,000 | $227,744 |
| 2022 | $1,819 | $161,987 | $16,500 | $145,487 |
| 2021 | $1,496 | $189,719 | $30,000 | $159,719 |
| 2020 | $1,342 | $189,719 | $30,000 | $159,719 |
| 2019 | $1,258 | $94,239 | $16,500 | $77,739 |
| 2018 | $915 | $62,991 | $16,500 | $46,491 |
| 2017 | $935 | $114,529 | $16,500 | $84,529 |
| 2016 | $887 | $60,777 | $16,500 | $44,277 |
| 2015 | $838 | $56,752 | $16,500 | $40,252 |
| 2014 | $838 | $54,835 | $16,500 | $38,335 |
| 2013 | -- | $54,836 | $13,338 | $41,498 |
Source: Public Records
Map
Nearby Homes
- 1175 E 1310 S
- 4990 W 12000 N
- 505 E 1325 S
- 1115 S 350 E
- 1143 S 350 E
- 783 N 680 W Unit 202
- 1130 Cottonwood Ct
- 278 N 870 E Unit 17
- 1393 E 240 N Unit 53
- 781 N 300 E
- 1386 E 240 N Unit 40
- 1090 E Factory Rd
- 122 W 1200 S
- 128 W 1200 S Unit 23
- 131 N 950 E
- 131 950 E Unit 35
- 134 W 1200 S
- 140 W 1200 S
- 221 E 800 N
- 137 W 1025 S
- 5290 W 12000 N
- 1313 E 1400 S
- 1288 E 1310 S Unit 5
- 5250 W 12000 N
- 1216 S 1050 E
- 1245 E 1400 S
- 1337 S 1335 E
- 1248 E 1310 S
- 1248 E 1310 S Unit 7
- 1323 S 1335 E
- 1249 E 1400 S
- 1249 E 1400 S
- 1285 E 1310 S
- 1315 E 1310 S
- 1228 E 1310 S
- 1265 E 1310 S Unit 22
- 1391 E 1400 S
- 1391 E 1400 S
- 1225 E 1310 S Unit 20
- 1225 E 1310 S
Your Personal Tour Guide
Ask me questions while you tour the home.