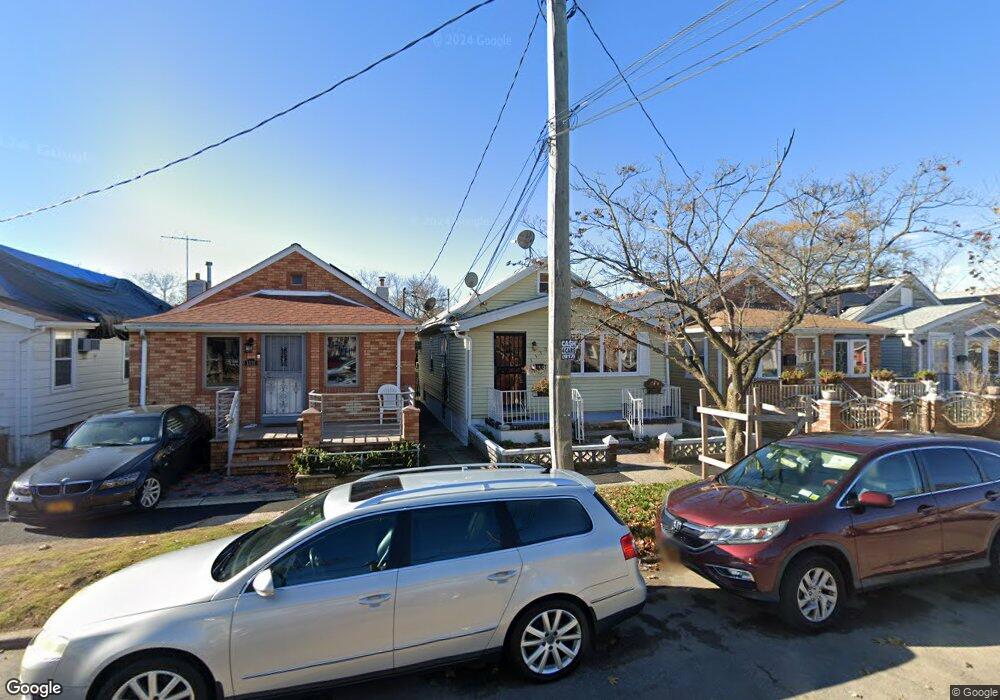
1330 E 98th St Brooklyn, NY 11236
Canarsie NeighborhoodEstimated Value: $570,861 - $707,000
Studio
--
Bath
870
Sq Ft
$752/Sq Ft
Est. Value
About This Home
This home is located at 1330 E 98th St, Brooklyn, NY 11236 and is currently estimated at $654,215, approximately $751 per square foot. 1330 E 98th St is a home located in Kings County with nearby schools including P.S. 279 Herman Schreiber, I.S. 211 John Wilson, and Canarsie Ascend Charter School.
Ownership History
Date
Name
Owned For
Owner Type
Purchase Details
Closed on
Aug 28, 2006
Sold by
Lovell Myrell
Bought by
Gilkes Cheryl
Current Estimated Value
Home Financials for this Owner
Home Financials are based on the most recent Mortgage that was taken out on this home.
Original Mortgage
$367,100
Outstanding Balance
$219,619
Interest Rate
6.79%
Mortgage Type
Purchase Money Mortgage
Estimated Equity
$434,596
Purchase Details
Closed on
Dec 17, 2004
Sold by
Ciambriello Pasquale
Bought by
Lovell Myrell
Home Financials for this Owner
Home Financials are based on the most recent Mortgage that was taken out on this home.
Original Mortgage
$224,000
Interest Rate
5.73%
Mortgage Type
Purchase Money Mortgage
Purchase Details
Closed on
Jul 22, 2003
Sold by
Ciambriello Olga
Bought by
Ciambriello Pasquale
Purchase Details
Closed on
Oct 17, 2001
Sold by
Ciambriello Olga
Bought by
Ciambriello Pasquale
Create a Home Valuation Report for This Property
The Home Valuation Report is an in-depth analysis detailing your home's value as well as a comparison with similar homes in the area
Home Values in the Area
Average Home Value in this Area
Purchase History
| Date | Buyer | Sale Price | Title Company |
|---|---|---|---|
| Gilkes Cheryl | $370,000 | -- | |
| Gilkes Cheryl | $370,000 | -- | |
| Lovell Myrell | $280,000 | -- | |
| Lovell Myrell | $280,000 | -- | |
| Ciambriello Pasquale | -- | -- | |
| Ciambriello Pasquale | -- | -- | |
| Ciambriello Pasquale | -- | The Title Guarantee Company | |
| Ciambriello Pasquale | -- | The Title Guarantee Company |
Source: Public Records
Mortgage History
| Date | Status | Borrower | Loan Amount |
|---|---|---|---|
| Open | Gilkes Cheryl | $367,100 | |
| Closed | Gilkes Cheryl | $367,100 | |
| Previous Owner | Lovell Myrell | $224,000 |
Source: Public Records
Tax History
| Year | Tax Paid | Tax Assessment Tax Assessment Total Assessment is a certain percentage of the fair market value that is determined by local assessors to be the total taxable value of land and additions on the property. | Land | Improvement |
|---|---|---|---|---|
| 2025 | $5,241 | $37,980 | $11,220 | $26,760 |
| 2024 | $5,241 | $42,240 | $11,220 | $31,020 |
| 2023 | $5,259 | $42,600 | $11,220 | $31,380 |
| 2022 | $4,877 | $42,300 | $11,220 | $31,080 |
| 2021 | $4,850 | $32,940 | $11,220 | $21,720 |
| 2020 | $2,275 | $29,820 | $11,220 | $18,600 |
| 2019 | $4,549 | $29,820 | $11,220 | $18,600 |
| 2018 | $4,399 | $21,580 | $10,676 | $10,904 |
| 2017 | $4,150 | $20,359 | $9,377 | $10,982 |
| 2016 | $3,840 | $19,207 | $8,803 | $10,404 |
| 2015 | $2,567 | $18,120 | $9,360 | $8,760 |
| 2014 | $2,567 | $18,120 | $9,360 | $8,760 |
Source: Public Records
Map
Nearby Homes
- 1130 E 99th St
- 1707 Rockaway Pkwy
- 9722 Avenue K
- 9804 Avenue L
- 1124 E 100th St
- 1769 Rockaway Pkwy
- 10009 Avenue L
- 1361 E 96th St
- 1154 E 101st St
- 1118 E 101st St
- 1791 Rockaway Pkwy
- 10016 Avenue L
- 1258 E 98th St
- 1242 E 100th St
- 1131 E 101st St
- 1250 E 98th St
- 1054 E 100th St
- 1241 E 98th St
- 1450 E 98th St
- 1115 E 102nd St
- 1332 E 98th St
- 1328 E 98th St
- 1332 E 98 St
- 1334 E 98th St
- 1326 E 98th St
- 1336 E 98th St
- 1324 E 98th St
- 1338 E 98th St
- 1322 E 98th St
- 1723 Rockaway Pkwy
- 1725 Rockaway Pkwy
- 1721 Rockaway Pkwy
- 1727 Rockaway Pkwy
- 1719 Rockaway Pkwy
- 1340 E 98th St
- 1320 E 98th St
- 1729 Rockaway Pkwy
- 1717 Rockaway Pkwy
- 1715 Rockaway Pkwy
- 1318 E 98th St
Your Personal Tour Guide
Ask me questions while you tour the home.