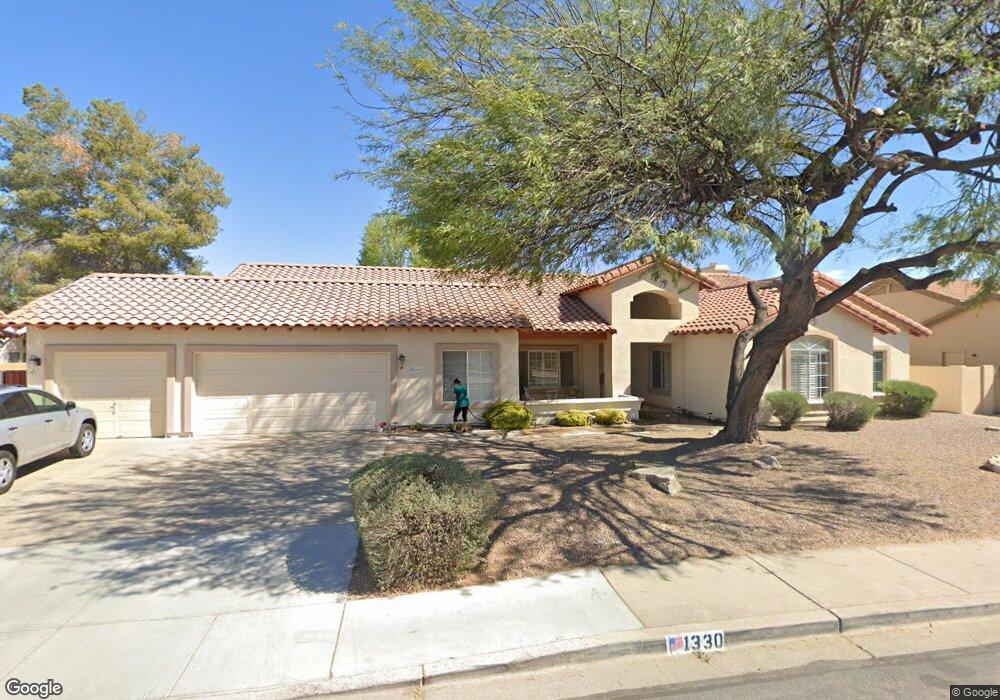
1330 E Ivanhoe St Chandler, AZ 85225
East Chandler NeighborhoodEstimated Value: $621,598 - $720,000
Studio
4
Baths
2,465
Sq Ft
$278/Sq Ft
Est. Value
About This Home
This home is located at 1330 E Ivanhoe St, Chandler, AZ 85225 and is currently estimated at $686,400, approximately $278 per square foot. 1330 E Ivanhoe St is a home located in Maricopa County with nearby schools including Sanborn Elementary School, Willis Junior High School, and Chandler High School.
Ownership History
Date
Name
Owned For
Owner Type
Purchase Details
Closed on
Nov 1, 2006
Sold by
Tumaliun Marie
Bought by
Grace Manor I Llc
Current Estimated Value
Purchase Details
Closed on
Apr 12, 2003
Sold by
Tumaliuan Nilo A and Tumaliuan Marie
Bought by
Tumaliuan Marie
Home Financials for this Owner
Home Financials are based on the most recent Mortgage that was taken out on this home.
Original Mortgage
$166,000
Interest Rate
5.17%
Mortgage Type
Purchase Money Mortgage
Purchase Details
Closed on
Aug 1, 2000
Sold by
Costales Grace A and Tumaliuan Marie
Bought by
Tumaliuan Nilo A and Tulaluan Marie
Purchase Details
Closed on
Dec 11, 1996
Sold by
Getz Michael B and Getz Robin D
Bought by
Costales Grace A and Tumaliuan Marie
Home Financials for this Owner
Home Financials are based on the most recent Mortgage that was taken out on this home.
Original Mortgage
$177,300
Interest Rate
7.46%
Mortgage Type
New Conventional
Create a Home Valuation Report for This Property
The Home Valuation Report is an in-depth analysis detailing your home's value as well as a comparison with similar homes in the area
Home Values in the Area
Average Home Value in this Area
Purchase History
| Date | Buyer | Sale Price | Title Company |
|---|---|---|---|
| Grace Manor I Llc | -- | None Available | |
| Tumaliuan Marie | -- | Fidelity National Title | |
| Tumaliuan Nilo A | -- | -- | |
| Costales Grace A | $197,000 | Ati Title Agency |
Source: Public Records
Mortgage History
| Date | Status | Borrower | Loan Amount |
|---|---|---|---|
| Previous Owner | Tumaliuan Marie | $166,000 | |
| Previous Owner | Costales Grace A | $177,300 |
Source: Public Records
Tax History
| Year | Tax Paid | Tax Assessment Tax Assessment Total Assessment is a certain percentage of the fair market value that is determined by local assessors to be the total taxable value of land and additions on the property. | Land | Improvement |
|---|---|---|---|---|
| 2025 | $3,114 | $33,300 | -- | -- |
| 2024 | $3,005 | $31,715 | -- | -- |
| 2023 | $3,005 | $47,080 | $9,410 | $37,670 |
| 2022 | $2,910 | $36,430 | $7,280 | $29,150 |
| 2021 | $2,991 | $34,680 | $6,930 | $27,750 |
| 2020 | $2,975 | $32,580 | $6,510 | $26,070 |
| 2019 | $2,870 | $30,330 | $6,060 | $24,270 |
| 2018 | $2,789 | $28,850 | $5,770 | $23,080 |
| 2017 | $2,620 | $27,320 | $5,460 | $21,860 |
| 2016 | $2,531 | $25,860 | $5,170 | $20,690 |
| 2015 | $2,427 | $26,120 | $5,220 | $20,900 |
Source: Public Records
Map
Nearby Homes
- 1402 E Shannon St
- 1146 E Dublin St
- 1030 N Mason Dr
- 1594 E Megan St
- 1070 E Oakland St
- 510 N Jesse Ct
- 1691 E Gary Dr
- 414 N Hudson Place
- 982 E Carla Vista Place
- 1650 E Countrywalk Ln
- 1779 E Oakland St
- 873 E Constitution Dr
- 741 N Soho Place
- 874 E Tyson St
- 238 N Hudson Place
- 1126 N Melody Cir
- 1940 E Oakland St
- 762 E Carla Vista Dr Unit 1
- 1449 E Kent Ave
- 1151 N Jackson St
- 1350 E Ivanhoe St
- 1310 E Ivanhoe St
- 1351 E Linda Ln
- 1331 E Linda Ln
- 1311 E Linda Ln
- 1371 E Linda Ln
- 1370 E Ivanhoe St
- 1290 E Ivanhoe St
- 1291 E Linda Ln
- 1352 E Linda Ln
- 1332 E Linda Ln
- 831 N Oxford Ln
- 1270 E Ivanhoe St
- 1322 E Linda Ln
- 6527 White Oak Ave
- 1271 E Linda Ln
- 1312 E Linda Ln
- 872 N Oxford Ln
- 882 N Oxford Ln
- 841 N Oxford Ln