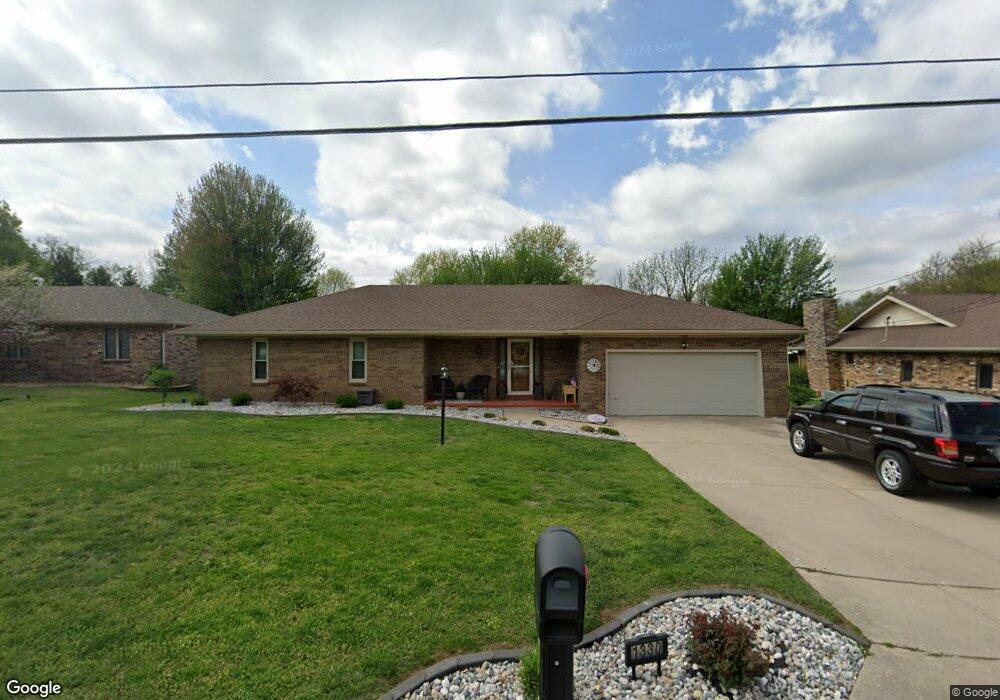
1330 E Smith St Springfield, MO 65803
Estimated Value: $214,000 - $248,000
3
Beds
2
Baths
1,639
Sq Ft
$145/Sq Ft
Est. Value
About This Home
This home is located at 1330 E Smith St, Springfield, MO 65803 and is currently estimated at $237,804, approximately $145 per square foot. 1330 E Smith St is a home located in Greene County with nearby schools including Truman Elementary School, Pleasant View K-8 School, and Hillcrest High School.
Ownership History
Date
Name
Owned For
Owner Type
Purchase Details
Closed on
Jun 5, 2013
Sold by
Pringle Pam and Proctor Pam
Bought by
Pringle Pam and Pringle Marvin James
Current Estimated Value
Home Financials for this Owner
Home Financials are based on the most recent Mortgage that was taken out on this home.
Original Mortgage
$109,300
Outstanding Balance
$23,403
Interest Rate
2.64%
Mortgage Type
New Conventional
Estimated Equity
$214,401
Purchase Details
Closed on
Feb 24, 2006
Sold by
Proctor Pam
Bought by
Proctor Lee Everett
Home Financials for this Owner
Home Financials are based on the most recent Mortgage that was taken out on this home.
Original Mortgage
$118,750
Interest Rate
6.24%
Mortgage Type
New Conventional
Purchase Details
Closed on
Feb 15, 2006
Sold by
Dykes Larry Carl
Bought by
Proctor Pam and Dykes Carl Perry
Home Financials for this Owner
Home Financials are based on the most recent Mortgage that was taken out on this home.
Original Mortgage
$118,750
Interest Rate
6.24%
Mortgage Type
New Conventional
Create a Home Valuation Report for This Property
The Home Valuation Report is an in-depth analysis detailing your home's value as well as a comparison with similar homes in the area
Purchase History
| Date | Buyer | Sale Price | Title Company |
|---|---|---|---|
| Pringle Pam | -- | None Available | |
| Proctor Lee Everett | -- | None Available | |
| Proctoer Lee Everett | -- | None Available | |
| Proctor Pam | $125 | None Available |
Source: Public Records
Mortgage History
| Date | Status | Borrower | Loan Amount |
|---|---|---|---|
| Open | Pringle Pam | $109,300 | |
| Previous Owner | Proctor Pam | $118,750 |
Source: Public Records
Tax History
| Year | Tax Paid | Tax Assessment Tax Assessment Total Assessment is a certain percentage of the fair market value that is determined by local assessors to be the total taxable value of land and additions on the property. | Land | Improvement |
|---|---|---|---|---|
| 2025 | $1,643 | $32,980 | $6,270 | $26,710 |
| 2024 | $1,592 | $29,680 | $4,180 | $25,500 |
| 2023 | $1,583 | $29,680 | $4,180 | $25,500 |
| 2022 | $1,419 | $25,990 | $4,180 | $21,810 |
| 2021 | $1,419 | $25,990 | $4,180 | $21,810 |
| 2020 | $1,353 | $23,690 | $4,180 | $19,510 |
| 2019 | $1,315 | $23,690 | $4,180 | $19,510 |
| 2018 | $1,076 | $19,400 | $3,230 | $16,170 |
| 2017 | $1,065 | $19,400 | $3,230 | $16,170 |
| 2016 | $1,063 | $19,400 | $3,230 | $16,170 |
| 2015 | $1,054 | $19,400 | $3,230 | $16,170 |
| 2014 | -- | $19,400 | $3,230 | $16,170 |
Source: Public Records
Map
Nearby Homes
- 1414 E Smith St
- 1339 E McClernon St
- 1255 E Bonaire Dr
- 1502 E McClernon St
- 1113 E Smith St
- 1103 E Smith St
- 1107 E Smith St
- 1039 E Caravan St
- 1017 E McClernon St
- 1005 E McClernon St
- 4260 N State Highway H
- 3749 N Pickwick Ave
- 3753 N Pickwick Ave
- 1406 E Nora St
- 1349 E Stoneridge St
- 801 E Hill St
- 2723 N National Ave
- 1508 E Livingston St
- 1270 E Ogorman Ct
- 917 E Kerr St
- 1324 E Smith St
- 1340 E Smith St
- 1348 E Smith St
- 3235 N Fremont Ave
- 3244 N Rogers Ave
- 1308 E Smith St
- 1356 E Smith St
- 1359 E Smith St
- 1300 E Smith St
- 3254 N Rogers Ave
- 3253 N Fremont Ave
- 1366 E Smith St
- 1345 E McClernon St
- 3236 N Fremont Ave
- 1258 E Smith St
- 3253 N Rogers Ave
- 1351 E McClernon St
- 3270 N Rogers Ave
- 3269 N Fremont Ave
- 3244 N Fremont Ave
Your Personal Tour Guide
Ask me questions while you tour the home.