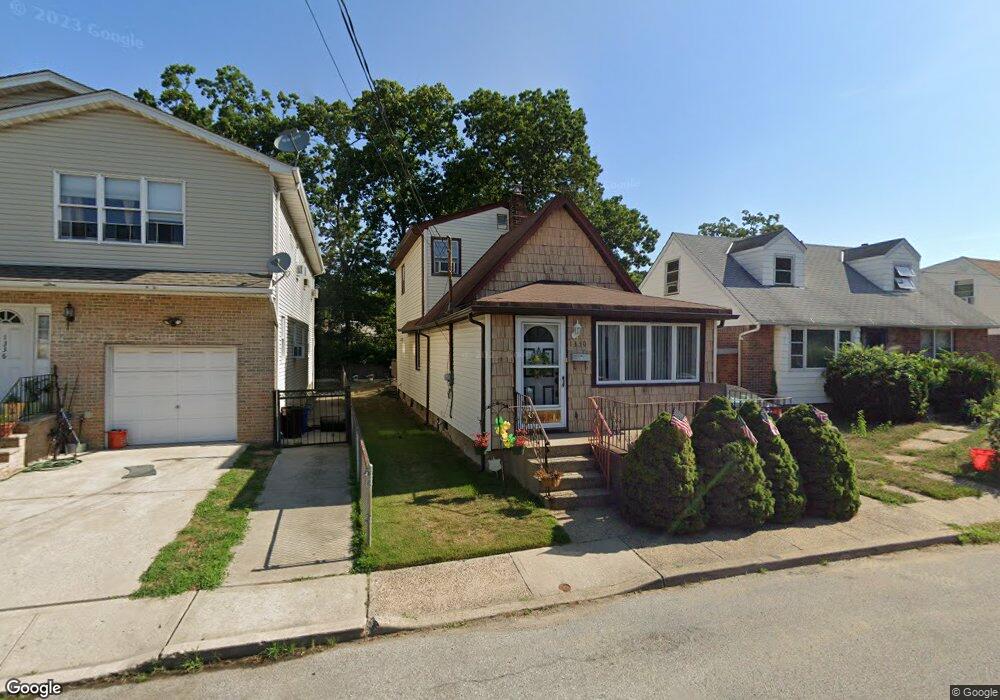
1330 K St Elmont, NY 11003
Estimated Value: $551,968 - $671,000
--
Bed
--
Bath
1,112
Sq Ft
$548/Sq Ft
Est. Value
About This Home
This home is located at 1330 K St, Elmont, NY 11003 and is currently estimated at $609,742, approximately $548 per square foot. 1330 K St is a home with nearby schools including Cheder at the Ohel.
Ownership History
Date
Name
Owned For
Owner Type
Purchase Details
Closed on
Mar 13, 2023
Sold by
Cumming Maryann and Cumming Ronald H
Bought by
Cumming Maryann
Current Estimated Value
Home Financials for this Owner
Home Financials are based on the most recent Mortgage that was taken out on this home.
Original Mortgage
$817,500
Outstanding Balance
$817,056
Interest Rate
7.08%
Mortgage Type
Reverse Mortgage Home Equity Conversion Mortgage
Estimated Equity
-$207,314
Purchase Details
Closed on
Sep 23, 2022
Sold by
Cumming Ronald H and Cumming Maryann
Bought by
Cumming Herbert C and Ronald & Maryann Cumming Irrevocable Tr
Create a Home Valuation Report for This Property
The Home Valuation Report is an in-depth analysis detailing your home's value as well as a comparison with similar homes in the area
Home Values in the Area
Average Home Value in this Area
Purchase History
| Date | Buyer | Sale Price | Title Company |
|---|---|---|---|
| Cumming Maryann | -- | None Available | |
| Cumming Maryann | -- | None Available | |
| Cumming Herbert C | -- | New York Title Research Corp | |
| Cumming Herbert C | -- | New York Title Research Corp |
Source: Public Records
Mortgage History
| Date | Status | Borrower | Loan Amount |
|---|---|---|---|
| Open | Cumming Maryann | $817,500 | |
| Closed | Cumming Maryann | $817,500 |
Source: Public Records
Tax History Compared to Growth
Tax History
| Year | Tax Paid | Tax Assessment Tax Assessment Total Assessment is a certain percentage of the fair market value that is determined by local assessors to be the total taxable value of land and additions on the property. | Land | Improvement |
|---|---|---|---|---|
| 2025 | $6,074 | $344 | $109 | $235 |
| 2024 | $2,948 | $352 | $112 | $240 |
| 2023 | $5,732 | $369 | $117 | $252 |
| 2022 | $5,732 | $368 | $117 | $251 |
| 2021 | $5,794 | $361 | $115 | $246 |
| 2020 | $5,515 | $484 | $398 | $86 |
| 2019 | $2,788 | $518 | $389 | $129 |
| 2017 | $2,823 | $567 | $395 | $172 |
| 2016 | $5,723 | $567 | $395 | $172 |
| 2015 | $2,766 | $612 | $426 | $186 |
| 2014 | $2,766 | $612 | $426 | $186 |
| 2013 | $2,585 | $612 | $426 | $186 |
Source: Public Records
Map
Nearby Homes