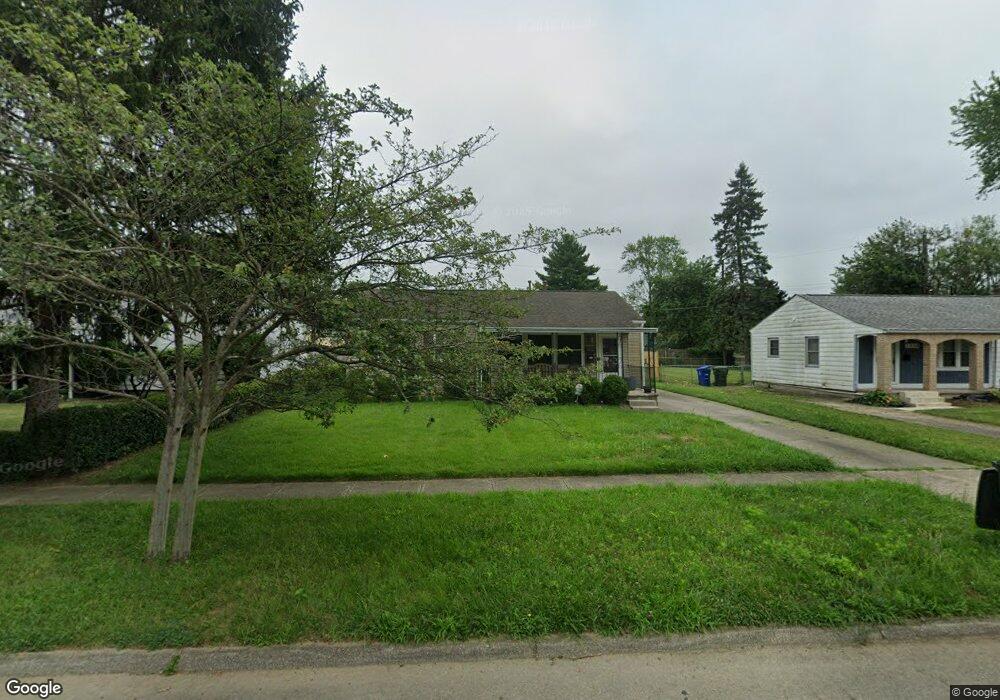
1330 Maetzel Dr Columbus, OH 43227
Shady Lane NeighborhoodEstimated Value: $209,709 - $239,000
3
Beds
2
Baths
1,300
Sq Ft
$175/Sq Ft
Est. Value
About This Home
This home is located at 1330 Maetzel Dr, Columbus, OH 43227 and is currently estimated at $227,427, approximately $174 per square foot. 1330 Maetzel Dr is a home located in Franklin County with nearby schools including Shady Lane Elementary School, Sherwood Middle School, and Walnut Ridge High School.
Ownership History
Date
Name
Owned For
Owner Type
Purchase Details
Closed on
May 5, 2010
Sold by
Fannie Mae
Bought by
Flohtn Properties Llc
Current Estimated Value
Purchase Details
Closed on
Mar 12, 2010
Sold by
Weaver Denise E
Bought by
Federal National Mortgage Association
Purchase Details
Closed on
May 5, 2004
Sold by
Weaver William E and Herald Angela
Bought by
Weaver Denise E
Home Financials for this Owner
Home Financials are based on the most recent Mortgage that was taken out on this home.
Original Mortgage
$75,200
Interest Rate
5.63%
Mortgage Type
Purchase Money Mortgage
Purchase Details
Closed on
Jul 7, 1994
Sold by
Tuckett Antoinette H
Bought by
Weaver William E and Weaver Denise E
Home Financials for this Owner
Home Financials are based on the most recent Mortgage that was taken out on this home.
Original Mortgage
$67,996
Interest Rate
8.61%
Mortgage Type
FHA
Purchase Details
Closed on
Feb 7, 1989
Purchase Details
Closed on
May 1, 1984
Create a Home Valuation Report for This Property
The Home Valuation Report is an in-depth analysis detailing your home's value as well as a comparison with similar homes in the area
Home Values in the Area
Average Home Value in this Area
Purchase History
| Date | Buyer | Sale Price | Title Company |
|---|---|---|---|
| Flohtn Properties Llc | $30,000 | Accutitle Agency Inc | |
| Federal National Mortgage Association | $48,000 | None Available | |
| Weaver Denise E | $93,000 | -- | |
| Weaver William E | $69,500 | -- | |
| -- | -- | -- | |
| -- | $46,500 | -- |
Source: Public Records
Mortgage History
| Date | Status | Borrower | Loan Amount |
|---|---|---|---|
| Previous Owner | Weaver Denise E | $75,200 | |
| Previous Owner | Weaver William E | $67,996 |
Source: Public Records
Tax History Compared to Growth
Tax History
| Year | Tax Paid | Tax Assessment Tax Assessment Total Assessment is a certain percentage of the fair market value that is determined by local assessors to be the total taxable value of land and additions on the property. | Land | Improvement |
|---|---|---|---|---|
| 2024 | $2,642 | $58,870 | $16,800 | $42,070 |
| 2023 | $2,608 | $58,870 | $16,800 | $42,070 |
| 2022 | $1,491 | $28,740 | $6,300 | $22,440 |
| 2021 | $1,493 | $28,740 | $6,300 | $22,440 |
| 2020 | $1,495 | $28,740 | $6,300 | $22,440 |
| 2019 | $1,421 | $23,420 | $5,040 | $18,380 |
| 2018 | $1,397 | $23,420 | $5,040 | $18,380 |
| 2017 | $1,420 | $23,420 | $5,040 | $18,380 |
| 2016 | $1,517 | $22,900 | $4,940 | $17,960 |
| 2015 | $1,377 | $22,900 | $4,940 | $17,960 |
| 2014 | $1,380 | $22,900 | $4,940 | $17,960 |
| 2013 | $800 | $26,915 | $5,810 | $21,105 |
Source: Public Records
Map
Nearby Homes
- 4501 Amesbury Rd
- 4530 Amesbury Rd
- 1281 Maetzel Dr
- 4484 Grimsby Rd
- 4467 Grimsby Rd
- 4295 Colby Ave
- 1571 Baxter Dr
- 1543 S Hamilton Rd
- 1563 Genoa Place
- 4571 Aragon Ave
- 1291 Westphal Ave
- 1068 Ross Rd
- 4677 E Livingston Ave
- 1618 S Hamilton Rd
- 4181 Colby Ave
- 1085 S Hamilton Rd
- 1607 Shady Lane Rd
- 1130 Little Plum Ln
- 1693 Gaynor Rd
- 1691 Shady Lane Rd
- 1322 Maetzel Dr
- 1338 Maetzel Dr
- 1333 Thurston Dr
- 1314 Maetzel Dr
- 1327 Thurston Dr
- 4486 Amesbury Rd
- 1348 Maetzel Dr
- 4498 Amesbury Rd
- 1317 Thurston Dr
- 1306 Maetzel Dr
- 1327 Maetzel Dr
- 1319 Maetzel Dr
- 1335 Maetzel Dr
- 1311 Maetzel Dr
- 1311 Thurston Dr
- 1345 Maetzel Dr
- 1298 Maetzel Dr
- 1305 Maetzel Dr
- 1303 Thurston Dr
- 1332 Thurston Dr