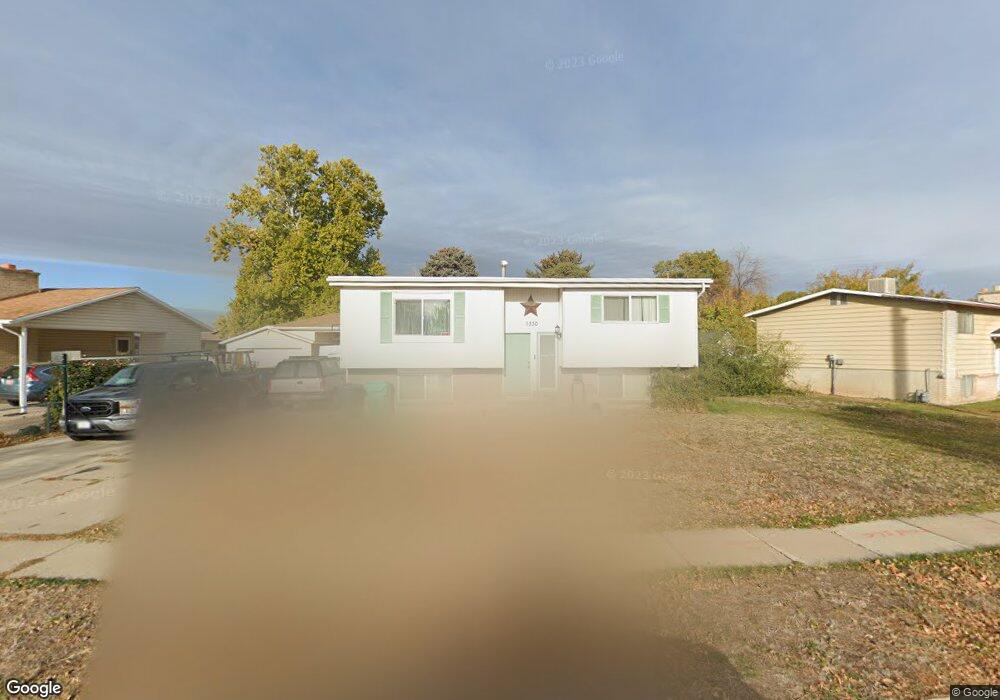
1330 Marilyn Dr Syracuse, UT 84075
Estimated Value: $391,000 - $417,909
6
Beds
2
Baths
1,898
Sq Ft
$213/Sq Ft
Est. Value
About This Home
This home is located at 1330 Marilyn Dr, Syracuse, UT 84075 and is currently estimated at $404,477, approximately $213 per square foot. 1330 Marilyn Dr is a home located in Davis County with nearby schools including Cook School, Syracuse Junior High School, and Syracuse High School.
Ownership History
Date
Name
Owned For
Owner Type
Purchase Details
Closed on
Oct 20, 2021
Sold by
Bayne Robert
Bought by
Linnell Austin Lee and Johnson Alisha Ann
Current Estimated Value
Home Financials for this Owner
Home Financials are based on the most recent Mortgage that was taken out on this home.
Original Mortgage
$343,660
Outstanding Balance
$314,332
Interest Rate
3.01%
Mortgage Type
FHA
Estimated Equity
$90,145
Purchase Details
Closed on
Dec 6, 2016
Sold by
Boswell Preston
Bought by
Bayne Robert
Purchase Details
Closed on
Oct 4, 2016
Sold by
Hud
Bought by
Boswell Preston
Purchase Details
Closed on
Mar 14, 2003
Sold by
Martinez Joe Frank and Martinez Paula
Bought by
Martinez Paul
Home Financials for this Owner
Home Financials are based on the most recent Mortgage that was taken out on this home.
Original Mortgage
$114,000
Interest Rate
4.5%
Create a Home Valuation Report for This Property
The Home Valuation Report is an in-depth analysis detailing your home's value as well as a comparison with similar homes in the area
Home Values in the Area
Average Home Value in this Area
Purchase History
| Date | Buyer | Sale Price | Title Company |
|---|---|---|---|
| Linnell Austin Lee | -- | Us Title Company Of U | |
| Bayne Robert | -- | Stewart Title | |
| Boswell Preston | -- | Stewart Title | |
| Martinez Paul | -- | Bonneville Title Company Inc |
Source: Public Records
Mortgage History
| Date | Status | Borrower | Loan Amount |
|---|---|---|---|
| Open | Linnell Austin Lee | $343,660 | |
| Previous Owner | Martinez Paul | $114,000 |
Source: Public Records
Tax History
| Year | Tax Paid | Tax Assessment Tax Assessment Total Assessment is a certain percentage of the fair market value that is determined by local assessors to be the total taxable value of land and additions on the property. | Land | Improvement |
|---|---|---|---|---|
| 2025 | $2,092 | $201,851 | $119,048 | $82,803 |
| 2024 | $2,033 | $197,450 | $93,118 | $104,332 |
| 2023 | $1,904 | $337,000 | $130,047 | $206,953 |
| 2022 | $2,007 | $194,700 | $75,579 | $119,121 |
| 2021 | $1,904 | $286,000 | $111,093 | $174,907 |
| 2020 | $1,664 | $242,000 | $99,435 | $142,565 |
| 2019 | $1,491 | $214,000 | $93,951 | $120,049 |
| 2018 | $1,319 | $188,000 | $92,465 | $95,535 |
| 2016 | $1,406 | $105,095 | $64,745 | $40,350 |
| 2015 | $1,021 | $72,655 | $35,610 | $37,045 |
| 2014 | $905 | $65,615 | $35,610 | $30,005 |
| 2013 | -- | $66,559 | $28,435 | $38,124 |
Source: Public Records
Map
Nearby Homes
- 1322 Marilyn Dr
- 1338 Marilyn Dr
- 1411 Valerie Ct
- 1316 Marilyn Dr
- 1407 Valerie Dr
- 1346 Marilyn Dr
- 1346 Marilyn Dr Unit 91
- 1415 Valerie Ct
- 1308 Ann St
- 1303 Ann St
- 1321 Marilyn Dr
- 1409 Valerie Dr
- 1321 Marilyn Dr
- 1310 Marilyn Dr
- 1409 Valerie Dr
- 1315 Marilyn Dr
- 1305 Ann St
- 1349 Marilyn Dr
- 1312 Ann St
- 1311 Marilyn Dr
Your Personal Tour Guide
Ask me questions while you tour the home.