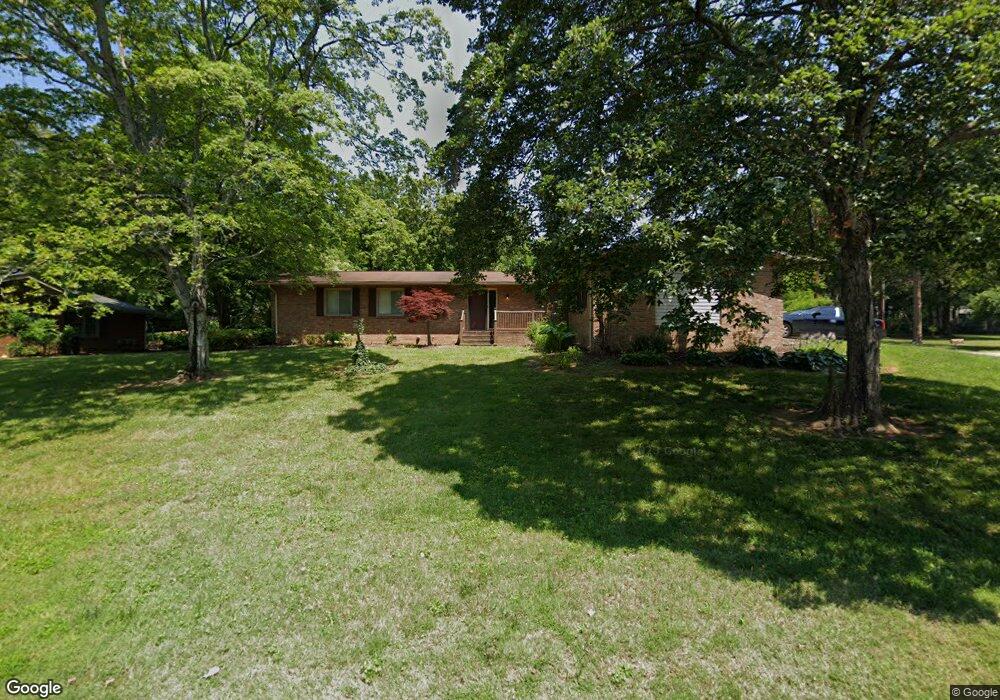
1330 Maxwell St Salisbury, NC 28144
Estimated Value: $301,497 - $326,000
3
Beds
2
Baths
1,680
Sq Ft
$187/Sq Ft
Est. Value
About This Home
This home is located at 1330 Maxwell St, Salisbury, NC 28144 and is currently estimated at $314,624, approximately $187 per square foot. 1330 Maxwell St is a home located in Rowan County with nearby schools including Carroll T Overton Elementary School, North Rowan Middle School, and Salisbury High School.
Ownership History
Date
Name
Owned For
Owner Type
Purchase Details
Closed on
Feb 1, 2022
Sold by
Blue Chair Investments Llc
Bought by
Coughnour Deborah L and Green Marcus J
Current Estimated Value
Home Financials for this Owner
Home Financials are based on the most recent Mortgage that was taken out on this home.
Original Mortgage
$260,101
Outstanding Balance
$241,230
Interest Rate
3.45%
Mortgage Type
FHA
Estimated Equity
$73,394
Purchase Details
Closed on
Oct 24, 2019
Sold by
Lee Leonard Jr Richard and Moore Leonard Mary
Bought by
Blue Chair Investments Llc
Purchase Details
Closed on
Feb 7, 2017
Sold by
Leonard Richard L and Leonard Mary S Moore
Bought by
S B L Properties Llc
Purchase Details
Closed on
Jun 18, 2013
Sold by
Thomas James E and Thomas Sherry E
Bought by
Leonard Richard Lee and Leonard Mary Sue
Purchase Details
Closed on
Nov 18, 2011
Sold by
White Mexi S
Bought by
Leonard Richard Lee and Leonard Mary Sue
Create a Home Valuation Report for This Property
The Home Valuation Report is an in-depth analysis detailing your home's value as well as a comparison with similar homes in the area
Home Values in the Area
Average Home Value in this Area
Purchase History
| Date | Buyer | Sale Price | Title Company |
|---|---|---|---|
| Coughnour Deborah L | $265,000 | Nance & Overbey Pllc | |
| Blue Chair Investments Llc | $450,000 | None Available | |
| S B L Properties Llc | -- | None Available | |
| Leonard Richard Lee | $60,000 | None Available | |
| Leonard Richard Lee | $85,000 | None Available |
Source: Public Records
Mortgage History
| Date | Status | Borrower | Loan Amount |
|---|---|---|---|
| Open | Coughnour Deborah L | $260,101 |
Source: Public Records
Tax History
| Year | Tax Paid | Tax Assessment Tax Assessment Total Assessment is a certain percentage of the fair market value that is determined by local assessors to be the total taxable value of land and additions on the property. | Land | Improvement |
|---|---|---|---|---|
| 2025 | $3,117 | $260,612 | $32,318 | $228,294 |
| 2024 | $3,117 | $260,612 | $32,318 | $228,294 |
| 2023 | $3,117 | $260,612 | $32,318 | $228,294 |
| 2022 | $2,142 | $155,514 | $23,622 | $131,892 |
| 2021 | $2,142 | $155,514 | $23,622 | $131,892 |
| 2020 | $2,142 | $155,514 | $23,622 | $131,892 |
| 2019 | $2,142 | $155,514 | $23,622 | $131,892 |
| 2018 | $1,747 | $128,594 | $23,568 | $105,026 |
| 2017 | $1,738 | $128,594 | $23,568 | $105,026 |
| 2016 | $1,690 | $128,594 | $23,568 | $105,026 |
| 2015 | $1,701 | $128,594 | $23,568 | $105,026 |
| 2014 | $1,733 | $132,618 | $23,568 | $109,050 |
Source: Public Records
Map
Nearby Homes
- 1329 Maxwell St
- 321 W 14th St
- 1460 N Jackson St
- 921 Confederate Ave
- 961 Confederate Ave
- 1111 N Jackson St
- 1201 N Church St
- 107 W 17th St
- 127 E 11th St
- 1008 N Main St
- 0 S Yadkin Ave Unit CAR4338761
- 1121 Richard St
- 113 E Miller St
- 233 Annandale Ave
- 10 North Rd
- 8 N Road Cir
- 1411 N Long St
- 115 E Steele St
- 0 W Henderson St
- 929 S Long St
- 1326 Maxwell St
- 409 W Midway St
- 1400 Maxwell St
- 1320 Maxwell St
- 412 Forest St
- 1331 Maxwell St
- 416 Forest St
- 1401 Maxwell St
- 1325 Maxwell St
- 411 W Midway St
- 1405 Maxwell St
- 1307 N Ellis St
- 1321 Maxwell St
- 1303 N Ellis St
- 231 Stonewall Rd
- 1310 Maxwell St
- 1409 Maxwell St
- 1315 Maxwell St
- 1430 N Jackson St
- 1420 N Jackson St
Your Personal Tour Guide
Ask me questions while you tour the home.