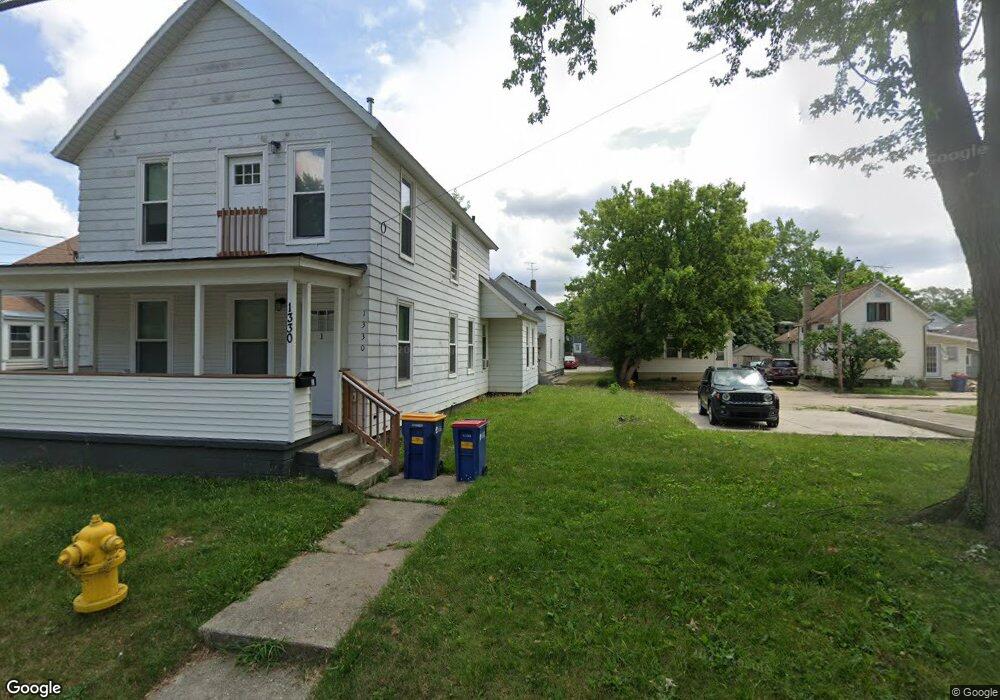
1330 Mc Reynolds Ave NW Grand Rapids, MI 49504
West Grand NeighborhoodEstimated Value: $218,000 - $275,000
5
Beds
2
Baths
1,591
Sq Ft
$156/Sq Ft
Est. Value
About This Home
This home is located at 1330 Mc Reynolds Ave NW, Grand Rapids, MI 49504 and is currently estimated at $248,331, approximately $156 per square foot. 1330 Mc Reynolds Ave NW is a home located in Kent County with nearby schools including Westwood Middle School, Union High School, and NexTech High School.
Ownership History
Date
Name
Owned For
Owner Type
Purchase Details
Closed on
Apr 19, 2023
Sold by
B08 Llc
Bought by
Felten Andrew
Current Estimated Value
Home Financials for this Owner
Home Financials are based on the most recent Mortgage that was taken out on this home.
Original Mortgage
$550,000
Outstanding Balance
$535,074
Interest Rate
6.73%
Mortgage Type
New Conventional
Estimated Equity
-$286,743
Purchase Details
Closed on
Dec 11, 2020
Sold by
Felten Andrew
Bought by
B08 Llc
Home Financials for this Owner
Home Financials are based on the most recent Mortgage that was taken out on this home.
Original Mortgage
$693,780
Interest Rate
2.71%
Mortgage Type
Commercial
Purchase Details
Closed on
May 19, 2016
Sold by
Estate Of Lois Ruth Frieberg
Bought by
Felten Andrew
Purchase Details
Closed on
Dec 4, 2012
Sold by
Frieberg Lois Ruth
Bought by
Frieberg Lois Ruth and Frieberg Lois Ruth
Purchase Details
Closed on
Dec 4, 1991
Sold by
Friebrg Friebrg E E and Ts Friebrg
Bought by
Frieberg Lois Ruth
Create a Home Valuation Report for This Property
The Home Valuation Report is an in-depth analysis detailing your home's value as well as a comparison with similar homes in the area
Home Values in the Area
Average Home Value in this Area
Purchase History
| Date | Buyer | Sale Price | Title Company |
|---|---|---|---|
| Felten Andrew | -- | None Listed On Document | |
| B08 Llc | -- | None Available | |
| Felten Andrew | $43,000 | None Available | |
| Frieberg Lois Ruth | -- | None Available | |
| Frieberg Lois Ruth | -- | -- |
Source: Public Records
Mortgage History
| Date | Status | Borrower | Loan Amount |
|---|---|---|---|
| Open | Felten Andrew | $550,000 | |
| Previous Owner | B08 Llc | $693,780 |
Source: Public Records
Tax History Compared to Growth
Tax History
| Year | Tax Paid | Tax Assessment Tax Assessment Total Assessment is a certain percentage of the fair market value that is determined by local assessors to be the total taxable value of land and additions on the property. | Land | Improvement |
|---|---|---|---|---|
| 2025 | $2,666 | $96,900 | $0 | $0 |
| 2024 | $2,666 | $85,800 | $0 | $0 |
| 2023 | $1,603 | $62,200 | $0 | $0 |
| 2022 | $2,210 | $76,000 | $0 | $0 |
| 2021 | $2,154 | $67,500 | $0 | $0 |
| 2020 | $2,081 | $60,700 | $0 | $0 |
| 2019 | $2,131 | $48,900 | $0 | $0 |
| 2018 | $2,612 | $41,100 | $0 | $0 |
| 2017 | $2,226 | $35,000 | $0 | $0 |
| 2016 | $1,623 | $32,300 | $0 | $0 |
| 2015 | $1,271 | $32,300 | $0 | $0 |
| 2013 | -- | $29,300 | $0 | $0 |
Source: Public Records
Map
Nearby Homes
- 734 Crosby St NW
- 1253 Muskegon Ave NW
- 912 Arianna St NW
- 1446 Fremont Ave NW
- 1528 Alpine Ave NW
- 941 Arianna St NW
- 914 Courtney St NW
- 1351 Hamilton Ave NW
- 1617 Fremont Ave NW
- 1435 Pine Ave NW
- 1654 Alpine Ave NW
- 1032 Jennette Ave NW
- 1054 Crosby St NW
- 1044 Muskegon Ave NW Unit 1 & 2
- 1027 Jennette Ave NW
- 1014 Jennette Ave NW
- 1105 Crosby St NW
- 1328 Broadway Ave NW
- 1524 Powers Ave NW
- 705 11th St NW
- 1330 Mcreynolds Ave NW
- 1326 Mcreynolds Ave NW
- 1339 Anderson Place NW
- 1340 Anderson Place NW
- 1330 Anderson Place NW
- 1322 Mcreynolds Ave NW
- 1331 Mcreynolds Ave NW
- 1329 Mc Reynolds Ave NW
- 1335 Mcreynolds Ave NW
- 1326 Anderson Place NW
- 1329 Mcreynolds Ave NW
- 1342 Anderson Place NW
- 1347 Anderson Place NW
- 1325 Mcreynolds Ave NW
- 1322 Anderson Place NW
- 1318 Mcreynolds Ave NW
- 1341 Mcreynolds Ave NW
- 1321 Mc Reynolds Ave NW
- 1346 Anderson Place NW
- 1321 Mcreynolds Ave NW