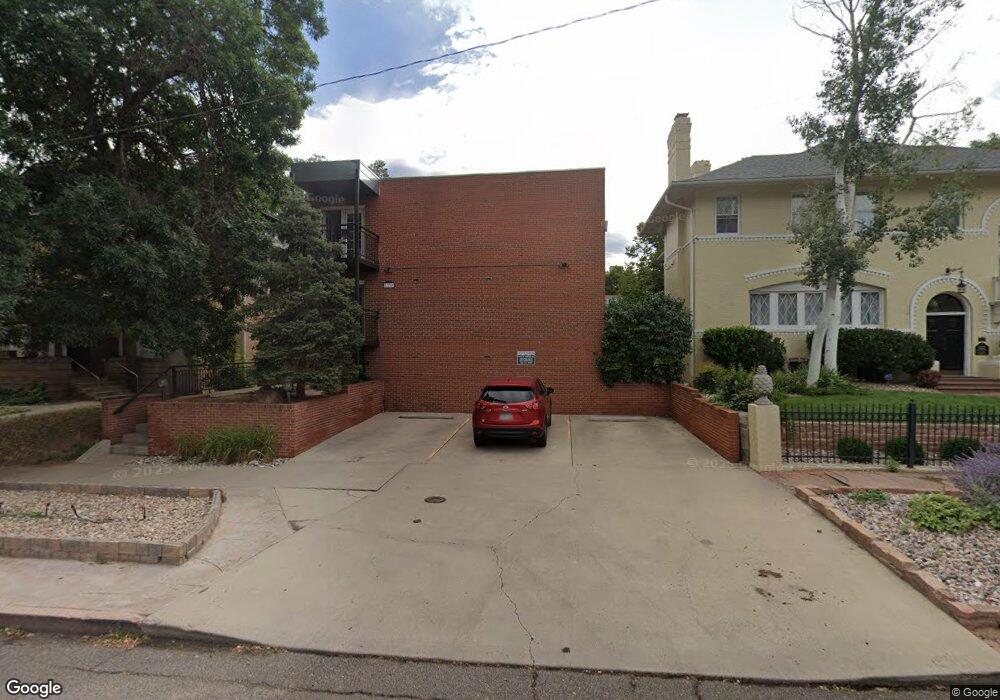
1330 Race St Unit 201 Denver, CO 80206
Cheesman Park NeighborhoodEstimated Value: $252,000 - $286,000
1
Bed
1
Bath
567
Sq Ft
$473/Sq Ft
Est. Value
About This Home
This home is located at 1330 Race St Unit 201, Denver, CO 80206 and is currently estimated at $268,279, approximately $473 per square foot. 1330 Race St Unit 201 is a home located in Denver County with nearby schools including Bromwell Elementary School, Morey Middle School, and East High School.
Ownership History
Date
Name
Owned For
Owner Type
Purchase Details
Closed on
Apr 29, 2019
Sold by
Penn Ryan and Penn Jennifer L
Bought by
Ochoa Jeremy Lee
Current Estimated Value
Home Financials for this Owner
Home Financials are based on the most recent Mortgage that was taken out on this home.
Original Mortgage
$237,650
Outstanding Balance
$208,942
Interest Rate
4.2%
Mortgage Type
New Conventional
Estimated Equity
$59,337
Purchase Details
Closed on
Oct 21, 2014
Sold by
Smith Kelly J
Bought by
Penn Ryan and Penn Jennifer L
Home Financials for this Owner
Home Financials are based on the most recent Mortgage that was taken out on this home.
Original Mortgage
$108,800
Interest Rate
4.16%
Mortgage Type
New Conventional
Purchase Details
Closed on
Jan 8, 2010
Sold by
1330 Race St Llc
Bought by
Smith Kelly J
Home Financials for this Owner
Home Financials are based on the most recent Mortgage that was taken out on this home.
Original Mortgage
$107,200
Interest Rate
4.8%
Mortgage Type
New Conventional
Create a Home Valuation Report for This Property
The Home Valuation Report is an in-depth analysis detailing your home's value as well as a comparison with similar homes in the area
Home Values in the Area
Average Home Value in this Area
Purchase History
| Date | Buyer | Sale Price | Title Company |
|---|---|---|---|
| Ochoa Jeremy Lee | $245,000 | Heritage Title Co | |
| Penn Ryan | $136,000 | Land Title Guarantee Company | |
| Smith Kelly J | $134,000 | Chicago Title Co |
Source: Public Records
Mortgage History
| Date | Status | Borrower | Loan Amount |
|---|---|---|---|
| Open | Ochoa Jeremy Lee | $237,650 | |
| Previous Owner | Penn Ryan | $108,800 | |
| Previous Owner | Smith Kelly J | $107,200 |
Source: Public Records
Tax History Compared to Growth
Tax History
| Year | Tax Paid | Tax Assessment Tax Assessment Total Assessment is a certain percentage of the fair market value that is determined by local assessors to be the total taxable value of land and additions on the property. | Land | Improvement |
|---|---|---|---|---|
| 2024 | $1,274 | $16,080 | $2,710 | $13,370 |
| 2023 | $1,246 | $16,080 | $2,710 | $13,370 |
| 2022 | $1,385 | $17,410 | $2,810 | $14,600 |
| 2021 | $1,385 | $17,910 | $2,890 | $15,020 |
| 2020 | $1,292 | $17,420 | $2,550 | $14,870 |
| 2019 | $1,256 | $17,420 | $2,550 | $14,870 |
| 2018 | $1,113 | $14,380 | $2,400 | $11,980 |
| 2017 | $1,109 | $14,380 | $2,400 | $11,980 |
| 2016 | $1,118 | $13,710 | $2,078 | $11,632 |
| 2015 | $1,071 | $13,710 | $2,078 | $11,632 |
| 2014 | $706 | $8,500 | $1,489 | $7,011 |
Source: Public Records
Map
Nearby Homes
- 1265 Race St Unit 202
- 1265 Race St Unit 208
- 1330 Race St Unit 3
- 1315 N High St
- 1364 Vine St
- 1243 Gaylord St Unit 304
- 1243 Gaylord St Unit 302
- 1200 Vine St Unit 2A
- 1200 Vine St Unit 4B
- 1355 Gaylord St Unit 4
- 2000 E 12th Ave Unit 14A
- 2000 E 12th Ave Unit 15D
- 1410 Vine St Unit 3
- 2115 E 14th Ave Unit 8
- 1150 Vine St Unit 1103
- 1150 Vine St Unit 902
- 1201 N Williams St Unit 2A
- 1201 N Williams St Unit 17A
- 1201 N Williams St Unit 2B
- 1176 Gaylord St Unit 101
- 1330 Race St Unit 104
- 1330 Race St Unit 2
- 1330 Race St Unit 103
- 1330 Race St Unit 204
- 1330 Race St
- 1330 Race St
- 1330 Race St
- 1330 Race St
- 1330 Race St
- 1330 Race St
- 1330 Race St
- 1330 Race St
- 1330 Race St
- 1330 Race St
- 1330 Race St
- 1330 Race St
- 1330 Race St Unit 4
- 1330 Race St Unit 102
- 1330 Race St Unit 101
- 1330 Race St Unit 202