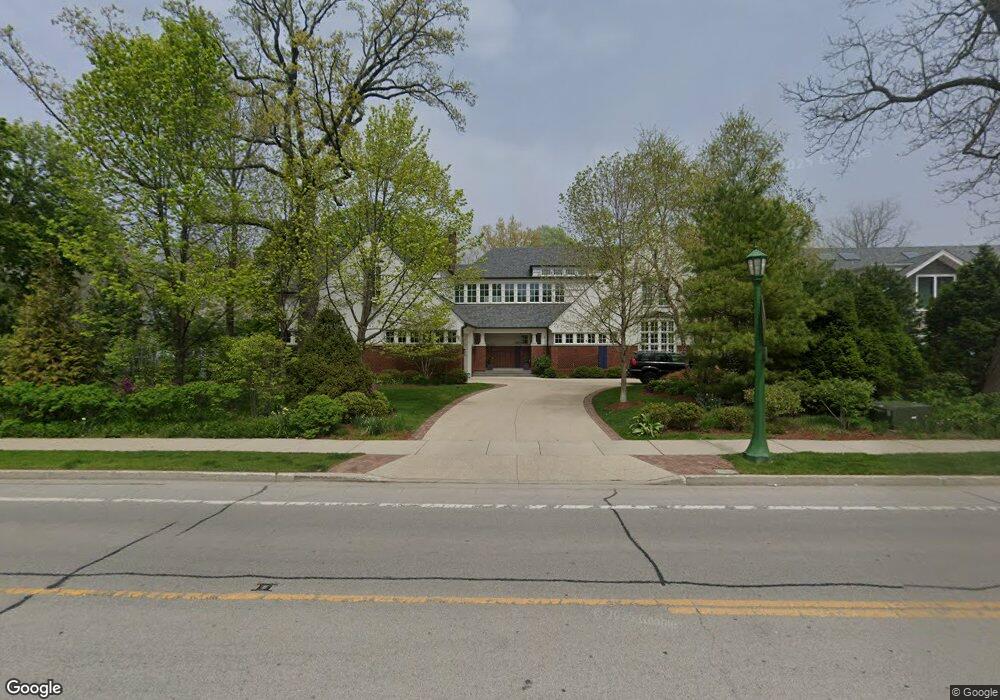
1330 Sheridan Rd Wilmette, IL 60091
Estimated Value: $2,801,000 - $3,779,939
5
Beds
4
Baths
4,999
Sq Ft
$630/Sq Ft
Est. Value
About This Home
This home is located at 1330 Sheridan Rd, Wilmette, IL 60091 and is currently estimated at $3,150,980, approximately $630 per square foot. 1330 Sheridan Rd is a home located in Cook County with nearby schools including Central Elementary School, Highcrest Middle School, and Wilmette Junior High School.
Ownership History
Date
Name
Owned For
Owner Type
Purchase Details
Closed on
Sep 19, 2016
Sold by
Wilson Frederick H and Morgante Elissa A
Bought by
Wilson Frederick H and The Federick H Wilson Trust Number One
Current Estimated Value
Purchase Details
Closed on
Jun 16, 2014
Sold by
Baugher Peter V and Baugher Robin S
Bought by
Wilson Frederick H and Morgante Elissa A
Purchase Details
Closed on
Jun 24, 2009
Sold by
Malles James E and Malles Marilyn J
Bought by
Baugher Peter and Baugher Robin S
Create a Home Valuation Report for This Property
The Home Valuation Report is an in-depth analysis detailing your home's value as well as a comparison with similar homes in the area
Home Values in the Area
Average Home Value in this Area
Purchase History
| Date | Buyer | Sale Price | Title Company |
|---|---|---|---|
| Wilson Frederick H | -- | Attorney | |
| Wilson Frederick H | $1,500,000 | Git | |
| Baugher Peter | $1,155,000 | Cti |
Source: Public Records
Tax History Compared to Growth
Tax History
| Year | Tax Paid | Tax Assessment Tax Assessment Total Assessment is a certain percentage of the fair market value that is determined by local assessors to be the total taxable value of land and additions on the property. | Land | Improvement |
|---|---|---|---|---|
| 2024 | $58,644 | $261,755 | $67,144 | $194,611 |
| 2023 | $65,846 | $310,000 | $67,144 | $242,856 |
| 2022 | $65,846 | $310,000 | $67,144 | $242,856 |
| 2021 | $53,608 | $209,680 | $64,746 | $144,934 |
| 2020 | $52,791 | $209,680 | $64,746 | $144,934 |
| 2019 | $51,209 | $227,913 | $64,746 | $163,167 |
| 2018 | $64,063 | $272,712 | $52,756 | $219,956 |
| 2017 | $79,606 | $347,500 | $105,512 | $241,988 |
| 2016 | $103,506 | $476,198 | $105,512 | $370,686 |
| 2015 | $31,603 | $127,301 | $95,920 | $31,381 |
| 2014 | $10,545 | $43,164 | $43,164 | $0 |
| 2013 | $10,070 | $43,164 | $43,164 | $0 |
Source: Public Records
Map
Nearby Homes
- 512 Elmwood Ave
- 901 Westerfield Dr
- 1616 Sheridan Rd Unit 9H
- 1630 Sheridan Rd Unit 5K
- 1630 Sheridan Rd Unit 2F
- 1630 Sheridan Rd Unit 2N
- 1630 Sheridan Rd Unit 2J
- 900 Sheridan Rd
- 315 Washington Ave
- 1025 Central Ave
- 724 12th St Unit 105
- 526 Linden Ave
- 621 Green Bay Rd
- 141 Kenilworth Ave
- 501 Sheridan Rd
- 1142 Oakwood Ave
- 527 Warwick Rd
- 528 Roslyn Rd
- 410 Prairie Ave
- 517 Cumnor Rd
- 1310 Sheridan Rd
- 1300 Sheridan Rd
- 1325 Sheridan Rd
- 1204 Michigan Ave
- 1315 Sheridan Rd
- 1331 Sheridan Rd
- 1174 Michigan Ave
- 725 Chestnut Ave
- 1305 Sheridan Rd
- 735 Chestnut Ave
- 714 Ashland Ave
- 720 Ashland Ave
- 730 Chestnut Ave
- 1410 Sheridan Rd Unit 4A
- 1410 Sheridan Rd Unit 5A
- 1410 Sheridan Rd Unit 6B
- 1410 Sheridan Rd Unit 5B
- 1410 Sheridan Rd Unit 3B
- 1410 Sheridan Rd Unit 5D
- 1410 Sheridan Rd Unit 1D