1330 Tirol Dr Incline Village, NV 89451
Estimated Value: $765,034 - $1,012,000
2
Beds
2
Baths
1,554
Sq Ft
$539/Sq Ft
Est. Value
About This Home
This home is located at 1330 Tirol Dr, Incline Village, NV 89451 and is currently estimated at $837,259, approximately $538 per square foot. 1330 Tirol Dr is a home located in Washoe County with nearby schools including Incline Elementary School, Incline Middle School, and Incline High School.
Ownership History
Date
Name
Owned For
Owner Type
Purchase Details
Closed on
Feb 21, 2023
Sold by
Moss Family Trust
Bought by
Moss Family Trust
Current Estimated Value
Purchase Details
Closed on
Mar 9, 2017
Sold by
Moss Scott A
Bought by
Moss Scott A and Scott A Moss Family Trust
Purchase Details
Closed on
May 31, 2011
Sold by
Carlson Nancy
Bought by
Carlson Harold R and Carlson Nancy M
Purchase Details
Closed on
May 14, 2009
Sold by
Moss Gregory E and Moss Lisa J
Bought by
Moss Gregory E and Moss Lisa J
Purchase Details
Closed on
Mar 22, 2005
Sold by
Moss Gregory E and Moss Lisa J
Bought by
Moss Gregory E and Moss Lisa J
Purchase Details
Closed on
Jun 18, 2003
Sold by
Moss Gregory E
Bought by
Moss Gregory E and Moss Scott A
Purchase Details
Closed on
Dec 7, 1995
Sold by
Moss David L and Salvatierra Pamela M
Bought by
Moss Gregory E and Carlson Nancy
Purchase Details
Closed on
Nov 22, 1994
Sold by
Moss David L and Moss Leon J
Bought by
Moss David L
Create a Home Valuation Report for This Property
The Home Valuation Report is an in-depth analysis detailing your home's value as well as a comparison with similar homes in the area
Home Values in the Area
Average Home Value in this Area
Purchase History
| Date | Buyer | Sale Price | Title Company |
|---|---|---|---|
| Moss Family Trust | -- | None Listed On Document | |
| Moss Scott A | -- | None Available | |
| Carlson Harold R | -- | None Available | |
| Moss Gregory E | -- | None Available | |
| Moss Gregory E | -- | -- | |
| Moss Gregory E | -- | -- | |
| Moss Gregory E | $60,000 | -- | |
| Moss David L | -- | -- |
Source: Public Records
Tax History Compared to Growth
Tax History
| Year | Tax Paid | Tax Assessment Tax Assessment Total Assessment is a certain percentage of the fair market value that is determined by local assessors to be the total taxable value of land and additions on the property. | Land | Improvement |
|---|---|---|---|---|
| 2025 | $2,539 | $98,883 | $72,888 | $25,995 |
| 2024 | $2,539 | $94,706 | $68,425 | $26,281 |
| 2023 | $2,390 | $82,171 | $59,500 | $22,671 |
| 2022 | $2,572 | $72,451 | $52,063 | $20,389 |
| 2021 | $2,439 | $64,402 | $44,625 | $19,777 |
| 2020 | $2,439 | $55,187 | $34,808 | $20,379 |
| 2019 | $2,392 | $54,116 | $33,528 | $20,588 |
| 2018 | $2,347 | $49,825 | $29,155 | $20,670 |
| 2017 | $2,303 | $45,410 | $24,395 | $21,015 |
| 2016 | $2,265 | $43,580 | $22,313 | $21,267 |
| 2015 | $2,262 | $43,322 | $22,313 | $21,009 |
| 2014 | $2,220 | $51,255 | $29,750 | $21,505 |
| 2013 | -- | $58,346 | $36,593 | $21,753 |
Source: Public Records
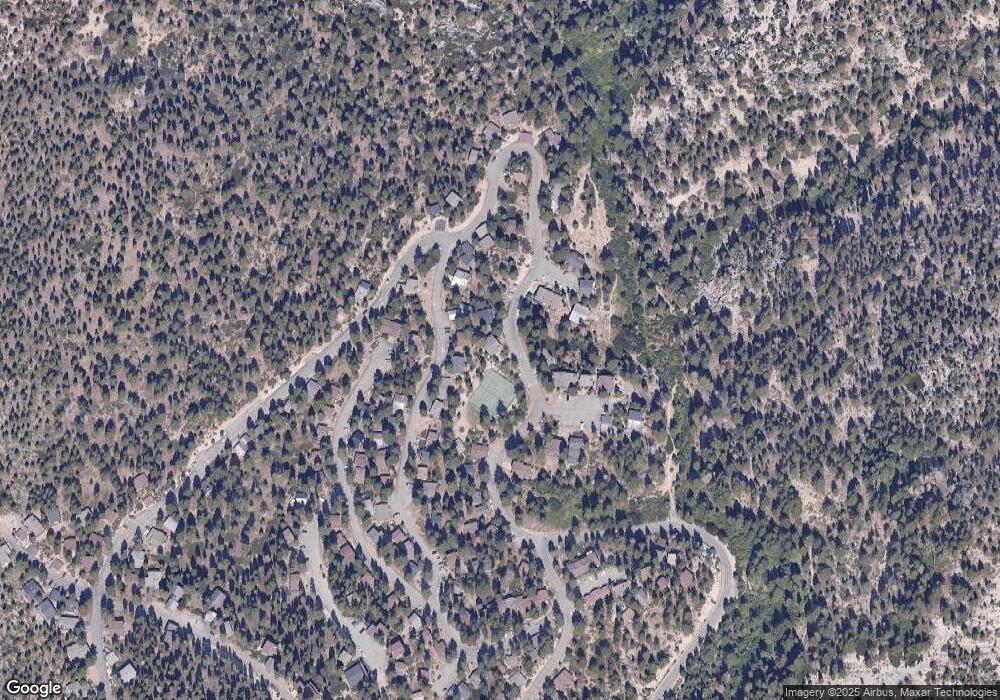
Map
Nearby Homes
- 1301 Arosa Ct Unit 3
- 1360 Valais Way
- 1392 Tirol Dr
- 1314 Saint Gallen Ct
- 449 Fairview Blvd
- 483 Skylake Ct
- 400 Fairview Blvd Unit 88
- 400 Fairview Blvd Unit 98
- 400 Fairview Blvd Unit 174
- 400 Fairview Blvd Unit 16
- 400 Fairview Blvd Unit 64
- 400 Fairview Blvd Unit 86
- 400 Fairview Blvd Unit 113
- 575 Fairview Blvd
- 387 2nd Tee
- 517 Driver Way
- 577 Eagle Dr
- 708 Champagne Rd
- 714 Champagne Rd
- 949 Fairview Blvd
- 1332 Tirol Dr
- 1336 Tirol Dr Unit M53
- 1338 Tirol Dr
- 1364 Zurich Ln
- 1327 Tirol Dr Unit 3
- 1362 Zurich Ln
- 1366 Zurich Ln
- 1299 Arosa Ct
- 1299 Arosa Ct Unit 3
- 1302 Uri Ct Unit 3
- 1302 Uri Ct Unit M-44
- 1301 Arosa Ct
- 1300 Uri Ct
- 1304 Uri Ct
- 1360 Zurich Ln Unit C16
- 1303 Arosa Ct
- 1368 Zurich Ln
- 1308 Uri Ct
- 1305 Arosa Ct
- 1310 Uri Ct Unit 3