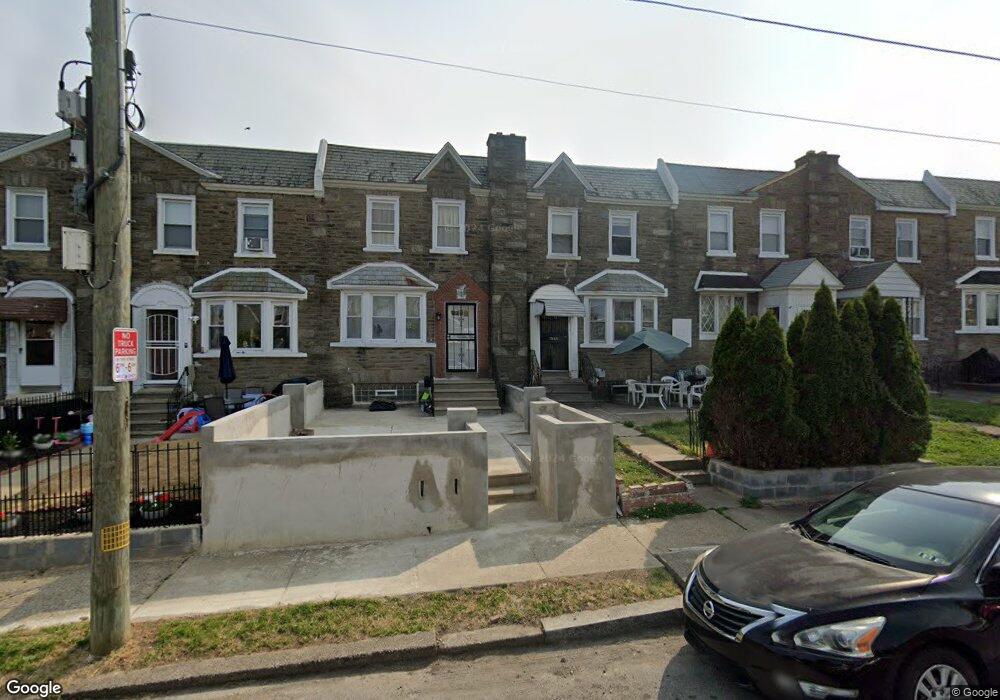
1330 Unruh Ave Philadelphia, PA 19111
Castor Gardens NeighborhoodEstimated Value: $177,000 - $230,000
3
Beds
1
Bath
1,212
Sq Ft
$169/Sq Ft
Est. Value
About This Home
This home is located at 1330 Unruh Ave, Philadelphia, PA 19111 and is currently estimated at $205,301, approximately $169 per square foot. 1330 Unruh Ave is a home located in Philadelphia County with nearby schools including J. Hampton Moore School, Castor Gardens Middle School, and Northeast High School.
Ownership History
Date
Name
Owned For
Owner Type
Purchase Details
Closed on
Nov 29, 2024
Sold by
Ma Vivian Nghi
Bought by
Cheng Hiu Na
Current Estimated Value
Home Financials for this Owner
Home Financials are based on the most recent Mortgage that was taken out on this home.
Original Mortgage
$170,000
Outstanding Balance
$151,591
Interest Rate
6.54%
Mortgage Type
New Conventional
Estimated Equity
$53,710
Purchase Details
Closed on
Apr 14, 2023
Sold by
Ma David
Bought by
Ma Vivian Nghi
Purchase Details
Closed on
Dec 28, 2004
Sold by
Ma Ut
Bought by
Ma Ut and Huynh Khan Quan
Purchase Details
Closed on
Aug 7, 2002
Sold by
Steve Bolotnya Borodowsky Mira and Steve Borodovosky
Bought by
Ma Ut
Home Financials for this Owner
Home Financials are based on the most recent Mortgage that was taken out on this home.
Original Mortgage
$56,250
Interest Rate
6.55%
Create a Home Valuation Report for This Property
The Home Valuation Report is an in-depth analysis detailing your home's value as well as a comparison with similar homes in the area
Home Values in the Area
Average Home Value in this Area
Purchase History
| Date | Buyer | Sale Price | Title Company |
|---|---|---|---|
| Cheng Hiu Na | $170,000 | None Listed On Document | |
| Cheng Hiu Na | $170,000 | None Listed On Document | |
| Ma Vivian Nghi | -- | None Listed On Document | |
| Ma Ut | -- | -- | |
| Ma Ut | $75,000 | First American Title Ins Co |
Source: Public Records
Mortgage History
| Date | Status | Borrower | Loan Amount |
|---|---|---|---|
| Open | Cheng Hiu Na | $170,000 | |
| Closed | Cheng Hiu Na | $170,000 | |
| Previous Owner | Ma Ut | $56,250 |
Source: Public Records
Tax History Compared to Growth
Tax History
| Year | Tax Paid | Tax Assessment Tax Assessment Total Assessment is a certain percentage of the fair market value that is determined by local assessors to be the total taxable value of land and additions on the property. | Land | Improvement |
|---|---|---|---|---|
| 2025 | $2,318 | $209,400 | $41,880 | $167,520 |
| 2024 | $2,318 | $209,400 | $41,880 | $167,520 |
| 2023 | $2,318 | $165,600 | $33,120 | $132,480 |
| 2022 | $1,670 | $165,600 | $33,120 | $132,480 |
| 2021 | $1,670 | $0 | $0 | $0 |
| 2020 | $1,670 | $0 | $0 | $0 |
| 2019 | $1,603 | $0 | $0 | $0 |
| 2018 | $1,554 | $0 | $0 | $0 |
| 2017 | $1,554 | $0 | $0 | $0 |
| 2016 | $1,539 | $0 | $0 | $0 |
| 2015 | $1,472 | $0 | $0 | $0 |
| 2014 | -- | $111,000 | $17,332 | $93,668 |
| 2012 | -- | $14,464 | $1,552 | $12,912 |
Source: Public Records
Map
Nearby Homes
- 1324 Unruh Ave
- 1353 Fanshawe St
- 1304 Fanshawe St
- 1353 Wells St
- 1417 Unruh Ave
- 1227 Fanshawe St
- 1314 Gilham St
- 1412 Magee Ave
- 1437 Magee Ave
- 1343 Greeby St
- 1300 Glenview St
- 1238 Gilham St
- 1328 Greeby St
- 1326 Greeby St
- 1216 Knorr St
- 1344 Greeby St
- 1409 Greeby St
- 1305 Glenview St
- 1223 Greeby St
- 1431 Greeby St
- 1332 Unruh Ave
- 1328 Unruh Ave
- 1334 Unruh Ave
- 1326 Unruh Ave
- 1336 Unruh Ave
- 1331 Fanshawe St
- 1333 Fanshawe St
- 1329 Fanshawe St
- 1338 Unruh Ave
- 1335 Fanshawe St
- 1327 Fanshawe St
- 1322 Unruh Ave
- 1337 Fanshawe St
- 1325 Fanshawe St
- 1340 Unruh Ave
- 1320 Unruh Ave
- 1339 Fanshawe St
- 1323 Fanshawe St
- 1342 Unruh Ave
- 1341 Fanshawe St