Estimated Value: $303,000 - $353,000
--
Bed
2
Baths
1,990
Sq Ft
$167/Sq Ft
Est. Value
About This Home
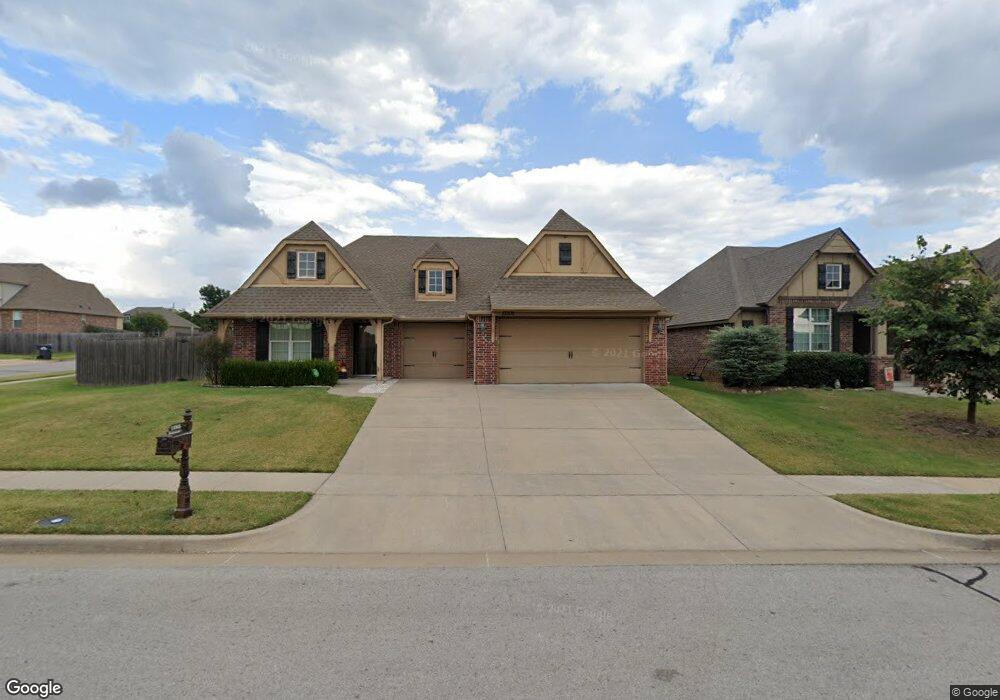
This home is located at 13305 S 21st Ct, Bixby, OK 74008 and is currently estimated at $331,608, approximately $166 per square foot. 13305 S 21st Ct is a home located in Tulsa County with nearby schools including Central Elementary School and Bixby Central Intermediate School.
Ownership History
Date
Name
Owned For
Owner Type
Purchase Details
Closed on
Jun 18, 2018
Sold by
Matheny Glenda F and Matheny Micheal Lamont
Bought by
Matheny Glenda F
Current Estimated Value
Home Financials for this Owner
Home Financials are based on the most recent Mortgage that was taken out on this home.
Original Mortgage
$217,550
Outstanding Balance
$187,349
Interest Rate
4.5%
Mortgage Type
New Conventional
Estimated Equity
$144,259
Purchase Details
Closed on
Jun 12, 2018
Sold by
Matheny Glenda F
Bought by
Jones Jacob A and Jones Kristin E
Home Financials for this Owner
Home Financials are based on the most recent Mortgage that was taken out on this home.
Original Mortgage
$217,550
Outstanding Balance
$187,349
Interest Rate
4.5%
Mortgage Type
New Conventional
Estimated Equity
$144,259
Purchase Details
Closed on
Dec 22, 2009
Sold by
Simmons Homes Residential Group Llc
Bought by
Matheny Glenda F and Matheny Michael L
Home Financials for this Owner
Home Financials are based on the most recent Mortgage that was taken out on this home.
Original Mortgage
$109,955
Interest Rate
4.8%
Mortgage Type
New Conventional
Create a Home Valuation Report for This Property
The Home Valuation Report is an in-depth analysis detailing your home's value as well as a comparison with similar homes in the area
Home Values in the Area
Average Home Value in this Area
Purchase History
| Date | Buyer | Sale Price | Title Company |
|---|---|---|---|
| Matheny Glenda F | -- | Frisco Title Co | |
| Jones Jacob A | $229,000 | Frisco Title Co | |
| Matheny Glenda F | $210,000 | Executives Title & Escrow Co |
Source: Public Records
Mortgage History
| Date | Status | Borrower | Loan Amount |
|---|---|---|---|
| Open | Jones Jacob A | $217,550 | |
| Previous Owner | Matheny Glenda F | $109,955 |
Source: Public Records
Tax History Compared to Growth
Tax History
| Year | Tax Paid | Tax Assessment Tax Assessment Total Assessment is a certain percentage of the fair market value that is determined by local assessors to be the total taxable value of land and additions on the property. | Land | Improvement |
|---|---|---|---|---|
| 2025 | $3,568 | $29,036 | $3,724 | $25,312 |
| 2024 | $3,542 | $29,161 | $3,910 | $25,251 |
| 2023 | $3,542 | $27,772 | $4,155 | $23,617 |
| 2022 | $3,436 | $26,450 | $4,655 | $21,795 |
| 2021 | $3,275 | $25,190 | $4,433 | $20,757 |
| 2020 | $3,221 | $25,190 | $4,433 | $20,757 |
| 2019 | $3,250 | $25,190 | $4,433 | $20,757 |
| 2018 | $2,991 | $23,100 | $4,433 | $18,667 |
| 2017 | $2,990 | $23,100 | $4,433 | $18,667 |
| 2016 | $3,030 | $23,100 | $4,433 | $18,667 |
| 2015 | $2,907 | $23,100 | $4,433 | $18,667 |
| 2014 | $2,941 | $23,100 | $4,433 | $18,667 |
Source: Public Records
Map
Nearby Homes
- 2325 E 134th St S
- 2052 E 133rd Ct
- 2333 E 134th St S
- 2353 E 134th St S
- 13401 S 20th Ct
- 13509 S 26th St
- 2707 E 135th St S
- 2719 E 135th St S
- 2611 E 135th Dr
- 2335 E 135th St S
- 13408 S 20th Ct
- 2354 E 134th St S
- 12929 S 21st Place E
- 12934 S 21st Place E
- 12933 S 21st Place E
- 13409 S 20th St
- 2347 E 135th St S
- Oak Plan at Torrey Lakes - Bixby
- 2709 E 134th St S
- 2504 E 135th Dr S
- 13305 S 21st Ct E
- 13313 S 21st Ct
- 13306 S 21st Ct
- 13310 S 21st Ct
- 13308 S 21st Place
- 2115 E 133rd St S
- 2119 E 133rd St S
- 13314 S 21st Ct
- 13312 S 21st Place
- 2111 E 133rd St S
- 13314 S 21st Place
- 2111 E 133rd St S
- 13304 S 21st Place
- 13317 S 21st Ct
- 13316 S 21st Place
- 13230 S 21st Place
- 13318 S 21st Place
- 13318 S 21st Ct
- 2107 E 133rd St S
- 13321 S 21st Ct