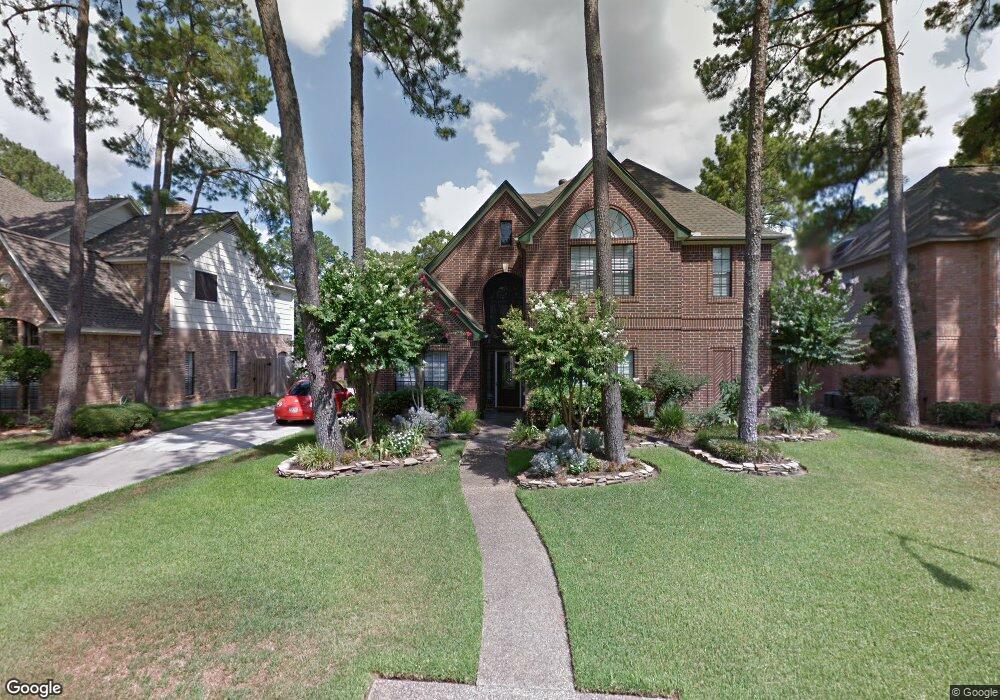
13306 Misty Hills Dr Cypress, TX 77429
Estimated Value: $472,910 - $519,000
4
Beds
4
Baths
3,117
Sq Ft
$158/Sq Ft
Est. Value
About This Home
This home is located at 13306 Misty Hills Dr, Cypress, TX 77429 and is currently estimated at $493,978, approximately $158 per square foot. 13306 Misty Hills Dr is a home located in Harris County with nearby schools including Hamilton Elementary School, Hamilton Middle School, and Cy-Fair High School.
Ownership History
Date
Name
Owned For
Owner Type
Purchase Details
Closed on
Jun 7, 2012
Sold by
Karvi Strong Kimberly K and Karvi Strong Kimberly
Bought by
Dollars Michael A
Current Estimated Value
Home Financials for this Owner
Home Financials are based on the most recent Mortgage that was taken out on this home.
Original Mortgage
$261,000
Outstanding Balance
$180,239
Interest Rate
3.83%
Mortgage Type
New Conventional
Estimated Equity
$313,739
Purchase Details
Closed on
Jan 27, 2012
Sold by
Strong Alan Christopher
Bought by
Strong Kimberly Karyl
Purchase Details
Closed on
May 24, 2007
Sold by
Mabry Warren W and Mabry Debra A
Bought by
Strong Alan C and Strong Kimberly K
Home Financials for this Owner
Home Financials are based on the most recent Mortgage that was taken out on this home.
Original Mortgage
$232,000
Interest Rate
6.17%
Mortgage Type
Purchase Money Mortgage
Create a Home Valuation Report for This Property
The Home Valuation Report is an in-depth analysis detailing your home's value as well as a comparison with similar homes in the area
Home Values in the Area
Average Home Value in this Area
Purchase History
| Date | Buyer | Sale Price | Title Company |
|---|---|---|---|
| Dollars Michael A | -- | None Available | |
| Dollars Michael A | -- | None Available | |
| Strong Kimberly Karyl | -- | None Available | |
| Strong Alan C | -- | Guardian Fidelity Title |
Source: Public Records
Mortgage History
| Date | Status | Borrower | Loan Amount |
|---|---|---|---|
| Open | Dollars Michael A | $261,000 | |
| Closed | Dollars Michael A | $261,000 | |
| Previous Owner | Strong Alan C | $232,000 |
Source: Public Records
Tax History Compared to Growth
Tax History
| Year | Tax Paid | Tax Assessment Tax Assessment Total Assessment is a certain percentage of the fair market value that is determined by local assessors to be the total taxable value of land and additions on the property. | Land | Improvement |
|---|---|---|---|---|
| 2025 | $5,864 | $396,420 | $97,664 | $298,756 |
| 2024 | $5,864 | $389,510 | $88,704 | $300,806 |
| 2023 | $5,864 | $400,254 | $88,704 | $311,550 |
| 2022 | $7,973 | $380,078 | $68,096 | $311,982 |
| 2021 | $7,638 | $305,000 | $68,096 | $236,904 |
| 2020 | $7,162 | $275,340 | $45,248 | $230,092 |
| 2019 | $7,287 | $270,000 | $43,904 | $226,096 |
| 2018 | $2,802 | $287,000 | $43,904 | $243,096 |
| 2017 | $15,467 | $287,000 | $43,904 | $243,096 |
| 2016 | $7,733 | $287,000 | $43,904 | $243,096 |
| 2015 | $5,674 | $303,893 | $43,904 | $259,989 |
| 2014 | $5,674 | $280,000 | $43,904 | $236,096 |
Source: Public Records
Map
Nearby Homes
- 13302 Autumn Valley Dr
- 13206 Vinca Ct
- 13114 Kathy Ln
- 13219 Allysum Ct
- 11718 Imperial Woods Ln
- 11627 Wilcant Ln
- 14507 Markhurst Dr
- 13119 Rosewood Glen Dr
- 13012 Kathy Ln
- 13018 Wincrest Ct
- 12910 Lake Mist Dr
- 13710 Casaba Ct
- 14706 Lindall Ct
- 12911 Bristol Berry Dr
- 13715 Meadow Sweet Dr
- 13718 Gainesway Dr
- 12911 Peach Meadow Dr
- 51 Wincrest Falls Dr
- 14039 Fairwood Breeze
- 13807 Meadow Sweet Dr
- 13302 Misty Hills Dr
- 13310 Misty Hills Dr
- 13319 Oddom Ct
- 13315 Oddom Ct
- 13323 Oddom Ct
- 13314 Misty Hills Dr
- 13222 Misty Hills Dr
- 13307 Misty Hills Dr
- 13313 Oddom Ct
- 13311 Misty Hills Dr
- 13303 Misty Hills Dr
- 13327 Oddom Ct
- 13315 Misty Hills Dr
- 13318 Misty Hills Dr
- 13218 Misty Hills Dr
- 13223 Misty Hills Dr
- 13311 Oddom Ct
- 13331 Oddom Ct
- 13319 Misty Hills Dr
- 13219 Misty Hills Dr