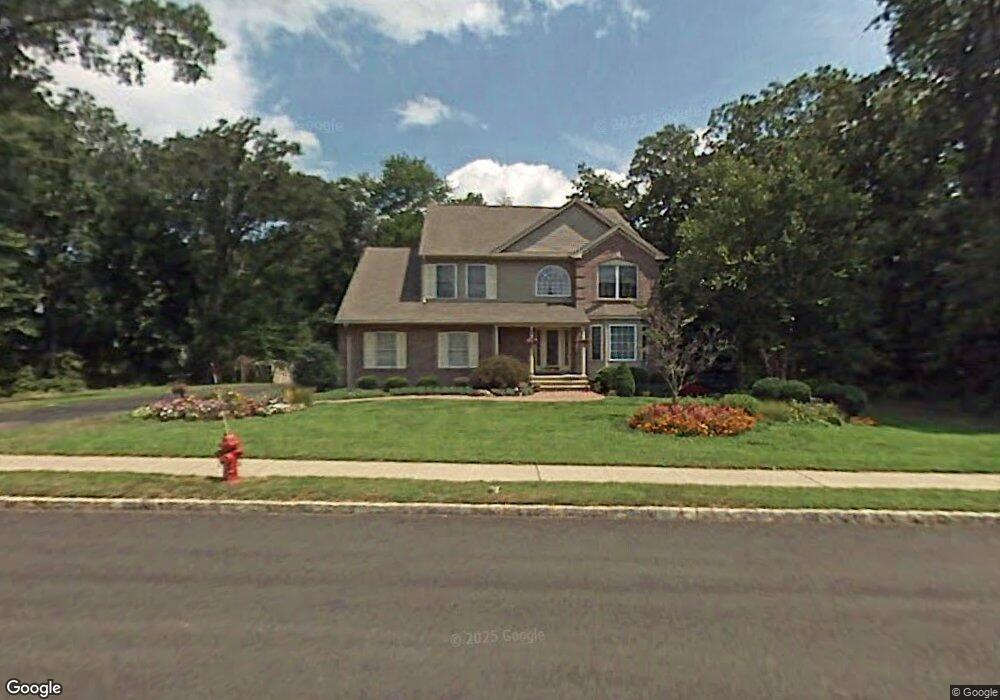
1331 Aaron Rd North Brunswick, NJ 08902
Estimated Value: $801,000 - $851,006
4
Beds
3
Baths
2,700
Sq Ft
$307/Sq Ft
Est. Value
About This Home
This home is located at 1331 Aaron Rd, North Brunswick, NJ 08902 and is currently estimated at $827,752, approximately $306 per square foot. 1331 Aaron Rd is a home located in Middlesex County with nearby schools including Livingston Park Elementary School, Linwood Middle School, and North Brunswick Twp High School.
Ownership History
Date
Name
Owned For
Owner Type
Purchase Details
Closed on
Oct 20, 2006
Sold by
Park Brian
Bought by
Lacsamana Pompeyo and Delapaz Elizabeth
Current Estimated Value
Purchase Details
Closed on
Aug 26, 1999
Sold by
Rand Art Llc
Bought by
Park Brian and Park Yuna
Home Financials for this Owner
Home Financials are based on the most recent Mortgage that was taken out on this home.
Original Mortgage
$221,000
Interest Rate
8.1%
Create a Home Valuation Report for This Property
The Home Valuation Report is an in-depth analysis detailing your home's value as well as a comparison with similar homes in the area
Home Values in the Area
Average Home Value in this Area
Purchase History
| Date | Buyer | Sale Price | Title Company |
|---|---|---|---|
| Lacsamana Pompeyo | $615,000 | -- | |
| Park Brian | $295,000 | -- |
Source: Public Records
Mortgage History
| Date | Status | Borrower | Loan Amount |
|---|---|---|---|
| Previous Owner | Park Brian | $221,000 |
Source: Public Records
Tax History Compared to Growth
Tax History
| Year | Tax Paid | Tax Assessment Tax Assessment Total Assessment is a certain percentage of the fair market value that is determined by local assessors to be the total taxable value of land and additions on the property. | Land | Improvement |
|---|---|---|---|---|
| 2025 | $17,570 | $277,300 | $90,800 | $186,500 |
| 2024 | $17,254 | $277,300 | $90,800 | $186,500 |
| 2023 | $17,254 | $277,300 | $90,800 | $186,500 |
| 2022 | $16,666 | $277,300 | $90,800 | $186,500 |
| 2021 | $12,143 | $277,300 | $90,800 | $186,500 |
| 2020 | $16,045 | $277,300 | $90,800 | $186,500 |
| 2019 | $15,717 | $277,300 | $90,800 | $186,500 |
| 2018 | $15,396 | $277,300 | $90,800 | $186,500 |
| 2017 | $15,124 | $277,300 | $90,800 | $186,500 |
| 2016 | $14,808 | $277,300 | $90,800 | $186,500 |
| 2015 | $14,555 | $277,300 | $90,800 | $186,500 |
| 2014 | $14,392 | $277,300 | $90,800 | $186,500 |
Source: Public Records
Map
Nearby Homes