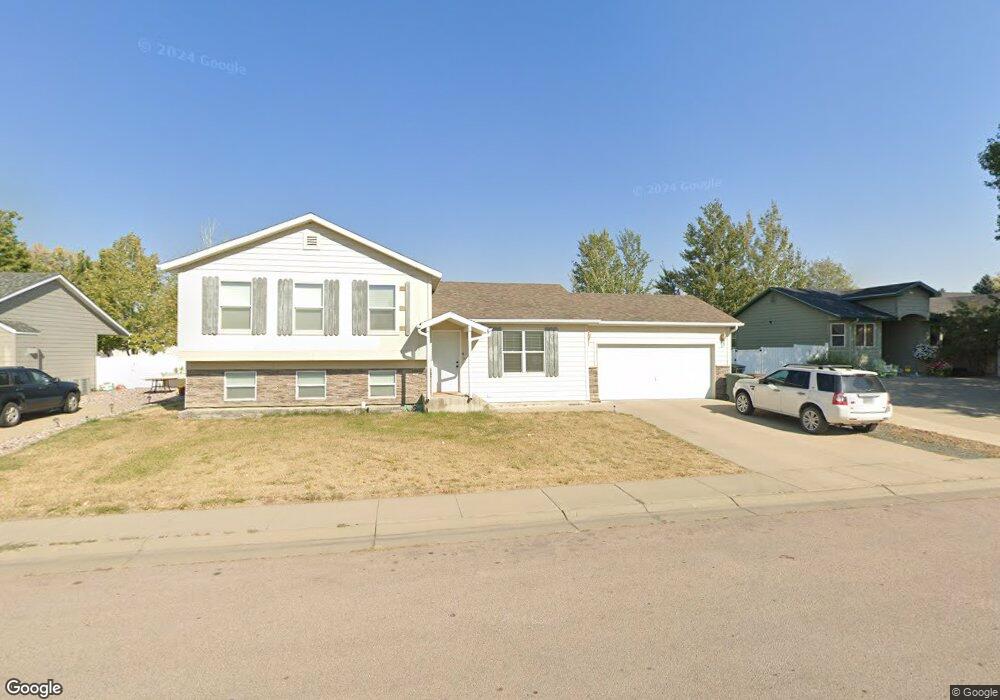
1331 Apple Blossom Way Gillette, WY 82716
Estimated Value: $201,000 - $345,000
4
Beds
3
Baths
1,764
Sq Ft
$167/Sq Ft
Est. Value
About This Home
This home is located at 1331 Apple Blossom Way, Gillette, WY 82716 and is currently estimated at $294,888, approximately $167 per square foot. 1331 Apple Blossom Way is a home located in Campbell County with nearby schools including Westwood High School, Hillcrest Elementary School, and Twin Spruce Junior High School.
Ownership History
Date
Name
Owned For
Owner Type
Purchase Details
Closed on
Jan 10, 2025
Sold by
Moerkerke Paige and Moerkerke Josiah
Bought by
Mcmackin Misti
Current Estimated Value
Home Financials for this Owner
Home Financials are based on the most recent Mortgage that was taken out on this home.
Original Mortgage
$314,105
Outstanding Balance
$311,924
Interest Rate
6.81%
Mortgage Type
FHA
Estimated Equity
-$17,036
Purchase Details
Closed on
Sep 30, 2022
Sold by
Council Of Community Services
Bought by
K & M Properties Llc
Home Financials for this Owner
Home Financials are based on the most recent Mortgage that was taken out on this home.
Original Mortgage
$231,750
Interest Rate
5.13%
Mortgage Type
Construction
Purchase Details
Closed on
Jan 27, 2009
Sold by
Mcglade Dan and Mcglade Rebecca
Bought by
Mcglade Rebecca
Purchase Details
Closed on
Sep 20, 2006
Sold by
Lawco Inc
Bought by
Mcglade Dan and Mcglade Rebecca
Create a Home Valuation Report for This Property
The Home Valuation Report is an in-depth analysis detailing your home's value as well as a comparison with similar homes in the area
Home Values in the Area
Average Home Value in this Area
Purchase History
| Date | Buyer | Sale Price | Title Company |
|---|---|---|---|
| Mcmackin Misti | -- | None Listed On Document | |
| K & M Properties Llc | -- | First American Title | |
| Mcglade Rebecca | -- | None Available | |
| Mcglade Dan | -- | None Available |
Source: Public Records
Mortgage History
| Date | Status | Borrower | Loan Amount |
|---|---|---|---|
| Open | Mcmackin Misti | $314,105 | |
| Previous Owner | K & M Properties Llc | $231,750 |
Source: Public Records
Tax History Compared to Growth
Tax History
| Year | Tax Paid | Tax Assessment Tax Assessment Total Assessment is a certain percentage of the fair market value that is determined by local assessors to be the total taxable value of land and additions on the property. | Land | Improvement |
|---|---|---|---|---|
| 2025 | $1,791 | $19,867 | $3,820 | $16,047 |
| 2024 | $1,791 | $25,470 | $4,897 | $20,573 |
| 2023 | $1,851 | $26,303 | $5,827 | $20,476 |
| 2022 | $1,580 | $22,393 | $5,352 | $17,041 |
| 2021 | $1,359 | $20,061 | $4,402 | $15,659 |
| 2020 | $1,359 | $19,969 | $4,402 | $15,567 |
| 2019 | $1,240 | $18,255 | $4,402 | $13,853 |
| 2018 | $1,201 | $17,759 | $4,402 | $13,357 |
| 2017 | $1,290 | $19,119 | $4,750 | $14,369 |
| 2016 | $1,299 | $19,227 | $3,088 | $16,139 |
| 2015 | -- | $18,795 | $3,088 | $15,707 |
| 2014 | -- | $19,120 | $3,088 | $16,032 |
Source: Public Records
Map
Nearby Homes
- 210 Overland Trail
- 1603 Monte Vista Ln
- 1706 Monte Vista Ln
- 913 A&B E 12th St
- 1041 Teton Cir
- 102 Overland Trail
- 1137 Boxelder Rd
- 1033 Santee Dr
- 1028 E 9th St
- 905 S Gurley Ave
- 1122 Boxelder Rd
- 4155 Butler-Spaeth Rd
- 1116 Boxelder Rd
- 1285 Country Club Rd
- 821 Madison St
- 9 Highland Ct
- 814 E 3rd St
- 700 S Brooks Ave
- 0 Boxelder Rd Unit 16-116
- 480 Boxelder Rd
- 1401 Apple Blossom Way
- 1327 Apple Blossom Way
- 1407 Eagles Nest Cir
- 1403 Eagles Nest Cir
- 1330 Wisteria Ct
- 1411 Eagles Nest Cir
- 1405 Apple Blossom Way
- 1323 Apple Blossom Way
- 1329 Carmel Ct
- 1401 Eagles Nest Cir
- 1323 Eagles Nest Cir
- 1409 &1411 Eagles Nest Cir
- 1321 Eagles Nest Cir
- 1401 Carmel Ct
- 1409 Apple Blossom Way
- 1319 Apple Blossom Way
- 1432 Eagles Nest Cir
- 1430 Eagles Nest Cir
- 1413 Eagles Nest Cir
- 1400 Wisteria Ct