Estimated Value: $162,000 - $176,393
3
Beds
1
Bath
1,073
Sq Ft
$157/Sq Ft
Est. Value
About This Home
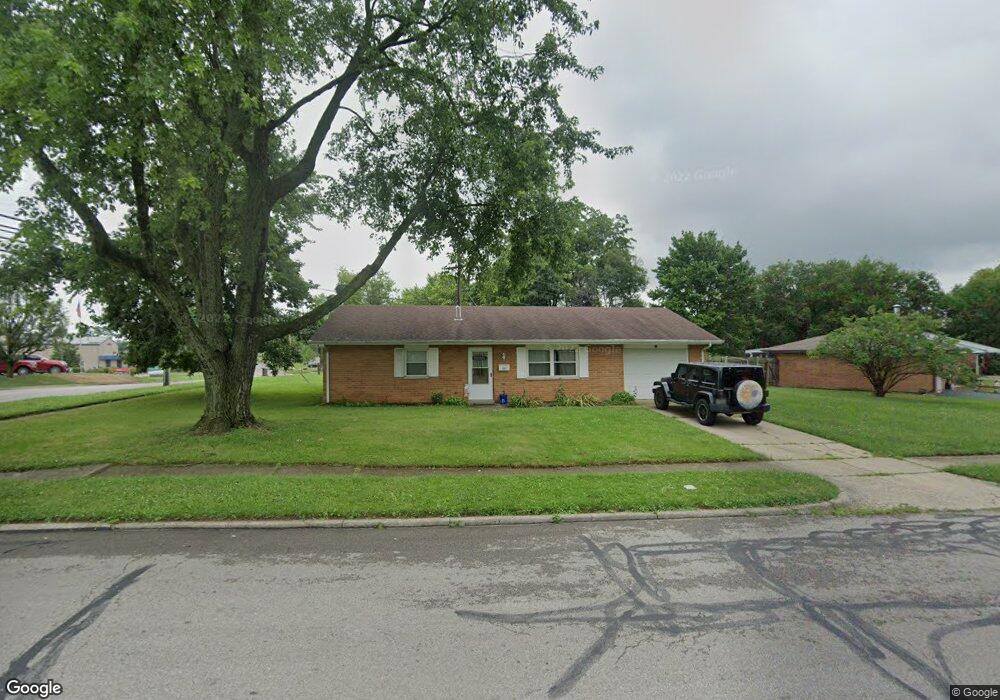
This home is located at 1331 Arrowhead Trail, Xenia, OH 45385 and is currently estimated at $168,098, approximately $156 per square foot. 1331 Arrowhead Trail is a home located in Greene County with nearby schools including Xenia High School, Summit Academy Community School for Alternative Learners - Xenia, and Legacy Christian Academy.
Ownership History
Date
Name
Owned For
Owner Type
Purchase Details
Closed on
Oct 11, 2013
Sold by
Welsh Ronald L and Welsh Robyn A
Bought by
Schemel William H
Current Estimated Value
Home Financials for this Owner
Home Financials are based on the most recent Mortgage that was taken out on this home.
Original Mortgage
$49,600
Outstanding Balance
$37,386
Interest Rate
4.58%
Mortgage Type
New Conventional
Estimated Equity
$130,712
Purchase Details
Closed on
Jul 3, 2008
Sold by
Bathia Pritam S and Bathia Kulwant K
Bought by
Welsh Ronald L and Welsh Robyn A
Home Financials for this Owner
Home Financials are based on the most recent Mortgage that was taken out on this home.
Original Mortgage
$64,518
Interest Rate
6.5%
Mortgage Type
FHA
Purchase Details
Closed on
Feb 7, 1997
Sold by
Bathla Pritam S
Bought by
Welsh Ronald L and Welsh A
Create a Home Valuation Report for This Property
The Home Valuation Report is an in-depth analysis detailing your home's value as well as a comparison with similar homes in the area
Home Values in the Area
Average Home Value in this Area
Purchase History
| Date | Buyer | Sale Price | Title Company |
|---|---|---|---|
| Schemel William H | $62,000 | None Available | |
| Welsh Ronald L | $75,000 | None Available | |
| Welsh Ronald L | $75,000 | -- |
Source: Public Records
Mortgage History
| Date | Status | Borrower | Loan Amount |
|---|---|---|---|
| Open | Schemel William H | $49,600 | |
| Previous Owner | Welsh Ronald L | $64,518 | |
| Closed | Welsh Ronald L | $0 |
Source: Public Records
Tax History Compared to Growth
Tax History
| Year | Tax Paid | Tax Assessment Tax Assessment Total Assessment is a certain percentage of the fair market value that is determined by local assessors to be the total taxable value of land and additions on the property. | Land | Improvement |
|---|---|---|---|---|
| 2024 | $1,917 | $44,800 | $10,590 | $34,210 |
| 2023 | $1,917 | $44,800 | $10,590 | $34,210 |
| 2022 | $1,592 | $31,740 | $6,230 | $25,510 |
| 2021 | $1,614 | $31,740 | $6,230 | $25,510 |
| 2020 | $1,546 | $31,740 | $6,230 | $25,510 |
| 2019 | $1,324 | $25,590 | $6,110 | $19,480 |
| 2018 | $1,329 | $25,590 | $6,110 | $19,480 |
| 2017 | $1,213 | $25,590 | $6,110 | $19,480 |
| 2016 | $1,213 | $22,920 | $6,110 | $16,810 |
| 2015 | $1,217 | $22,920 | $6,110 | $16,810 |
| 2014 | $1,165 | $22,920 | $6,110 | $16,810 |
Source: Public Records
Map
Nearby Homes
- 1208 Bellbrook Ave
- 1272 Bellbrook Ave
- 1618 Navajo Dr
- 1708 Ottawa Dr
- 1454 Kylemore Dr
- 1342 Kylemore Dr
- 1653 Seneca Dr
- 1881 Commonwealth Dr
- 1568 Cheyenne Dr
- 646 Glady Ave
- 1766 Gayhart Dr
- 1829 Gayhart Dr
- 1223 June Dr
- 1283 June Dr
- 1391 June Dr
- 1908 Whitt St
- 305-325 Bellbrook Ave
- 530 Cincinnati Ave
- 1255 Colorado Dr
- 1861 Iowa Dr
- 1359 Arrowhead Trail
- 1146 Bellbrook Ave
- 1100 Bellbrook Ave
- 1338 Arrowhead Trail
- 1350 Arrowhead Trail
- 1362 Arrowhead Trail
- 1387 Arrowhead Trail
- 1080 Bellbrook Ave
- 1170 Bellbrook Ave
- 1376 Arrowhead Trail
- 979 Deerfield Ct
- 1388 Arrowhead Trail
- 1182 Bellbrook Ave
- 1335 Peacepipe Trail
- 1323 Peacepipe Trail
- 1066 Bellbrook Ave
- 1349 Peacepipe Trail
- 1311 Peacepipe Trail
- 973 Deerfield Ct
- 1361 Peacepipe Trail