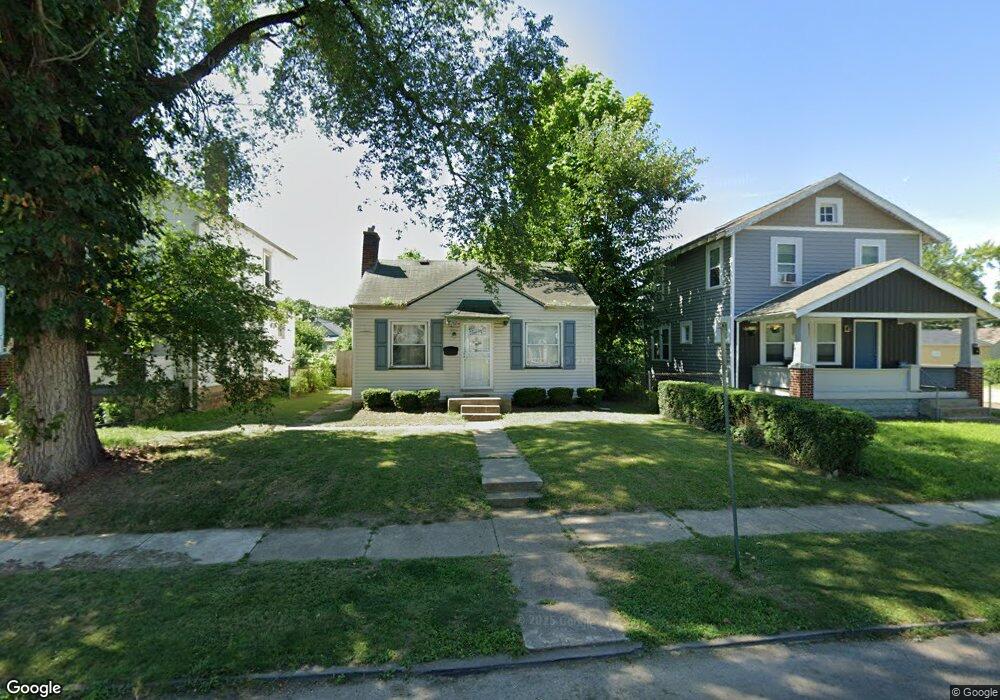
1331 E 19th Ave Columbus, OH 43211
South Linden NeighborhoodEstimated Value: $91,000 - $119,000
2
Beds
1
Bath
824
Sq Ft
$132/Sq Ft
Est. Value
About This Home
This home is located at 1331 E 19th Ave, Columbus, OH 43211 and is currently estimated at $109,102, approximately $132 per square foot. 1331 E 19th Ave is a home located in Franklin County with nearby schools including Windsor Stem Acadmey, Linden-Mckinley Stem School On Arcadia, and North Columbus Preparatory Academy.
Ownership History
Date
Name
Owned For
Owner Type
Purchase Details
Closed on
Feb 19, 1999
Sold by
Brislinger Roger and Brislinger Nancy
Bought by
Hawkins Myra A
Current Estimated Value
Home Financials for this Owner
Home Financials are based on the most recent Mortgage that was taken out on this home.
Original Mortgage
$45,600
Interest Rate
11.99%
Purchase Details
Closed on
May 6, 1998
Sold by
Property Owner Services Inc
Bought by
Brislinger Roger and Brislinger Nancy
Home Financials for this Owner
Home Financials are based on the most recent Mortgage that was taken out on this home.
Original Mortgage
$44,000
Interest Rate
10.45%
Purchase Details
Closed on
Apr 29, 1998
Sold by
The Huntington National Bank
Bought by
Property Owner Services Inc
Home Financials for this Owner
Home Financials are based on the most recent Mortgage that was taken out on this home.
Original Mortgage
$44,000
Interest Rate
10.45%
Purchase Details
Closed on
Jul 21, 1997
Sold by
Mcgimpsey Guy A
Bought by
The Huntington National Bank
Create a Home Valuation Report for This Property
The Home Valuation Report is an in-depth analysis detailing your home's value as well as a comparison with similar homes in the area
Home Values in the Area
Average Home Value in this Area
Purchase History
| Date | Buyer | Sale Price | Title Company |
|---|---|---|---|
| Hawkins Myra A | $57,000 | Independent Title | |
| Brislinger Roger | $55,000 | -- | |
| Property Owner Services Inc | $18,500 | -- | |
| The Huntington National Bank | $20,600 | -- |
Source: Public Records
Mortgage History
| Date | Status | Borrower | Loan Amount |
|---|---|---|---|
| Previous Owner | Hawkins Myra A | $45,600 | |
| Previous Owner | Brislinger Roger | $44,000 |
Source: Public Records
Tax History
| Year | Tax Paid | Tax Assessment Tax Assessment Total Assessment is a certain percentage of the fair market value that is determined by local assessors to be the total taxable value of land and additions on the property. | Land | Improvement |
|---|---|---|---|---|
| 2025 | $2,242 | $27,830 | $5,640 | $22,190 |
| 2024 | $2,242 | $27,830 | $5,640 | $22,190 |
| 2023 | $1,233 | $27,830 | $5,640 | $22,190 |
| 2022 | $669 | $12,890 | $2,560 | $10,330 |
| 2021 | $670 | $12,890 | $2,560 | $10,330 |
| 2020 | $671 | $12,890 | $2,560 | $10,330 |
| 2019 | $625 | $10,300 | $2,140 | $8,160 |
| 2018 | $677 | $8,550 | $2,140 | $6,410 |
| 2017 | $720 | $8,550 | $2,140 | $6,410 |
| 2016 | $921 | $13,900 | $2,770 | $11,130 |
| 2015 | $836 | $13,900 | $2,770 | $11,130 |
| 2014 | $838 | $13,900 | $2,770 | $11,130 |
| 2013 | $459 | $15,435 | $3,080 | $12,355 |
Source: Public Records
Map
Nearby Homes
- 1315 E 18th Ave
- 1386 E 22nd Ave
- 1201 E 20th Ave
- 1673 Cleveland Ave
- 1249-1251 E 15th Ave
- 1326 E 23rd Ave
- 1261 E 23rd Ave
- 1136 E 21st Ave
- 1335 E 25th Ave Unit 337
- 1092 E 15th Ave Unit 94
- 1468 E 25th Ave
- 1129 E 23rd Ave Unit 1129 - 1131
- 1109 Windsor Ave Unit 1103
- 1301 E 26th Ave
- 1045-1051 E 20th Ave
- 1088 E 22nd Ave
- 1047 E 21st Ave
- 1027 E 14th Ave
- 1033 E 22nd Ave
- 982 E 16th Ave
- 1335 E 19th Ave
- 1327 E 19th Ave
- 1339 E 19th Ave
- 1347 E 19th Ave
- 1315 E 19th Ave
- 1353 E 19th Ave
- 1324 E 18th Ave
- 1328 E 18th Ave
- 1311 E 19th Ave
- 1320 E 18th Ave
- 1332 E 19th Ave
- 1332 E 18th Ave
- 1338 E 19th Ave
- 1731 Louis Ave Unit 733
- 1320 E 19th Ave
- 1305 E 19th Ave Unit 307
- 1305 E 19th Ave Unit 7
- 1348 E 19th Ave
- 1357 E 19th Ave
- 1725 Louis Ave Unit 727