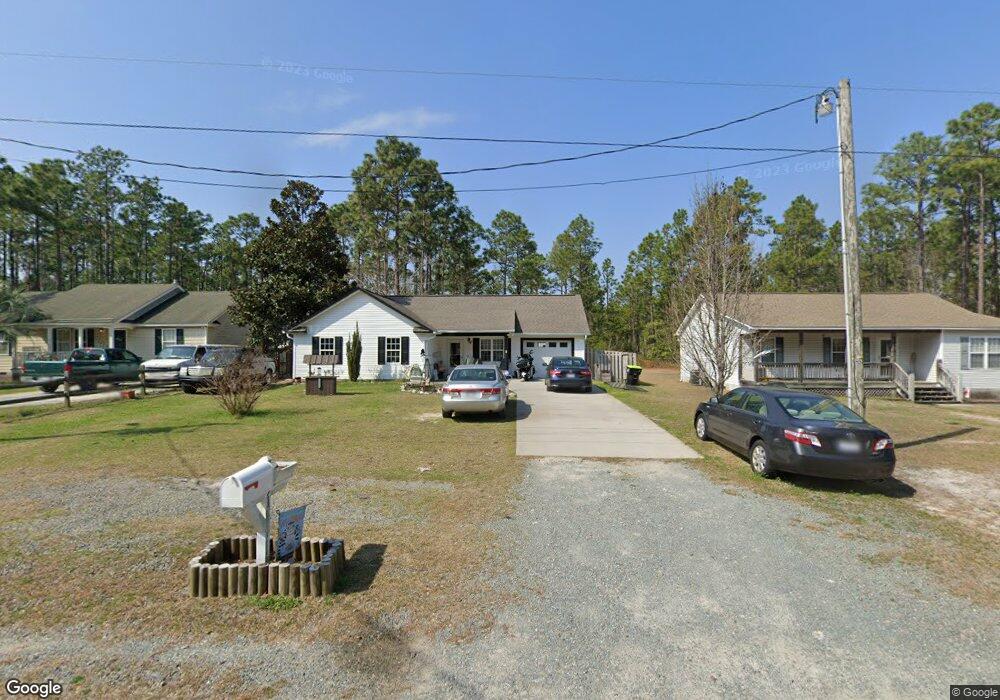
1331 Maple Rd Southport, NC 28461
Estimated Value: $258,000 - $288,000
3
Beds
2
Baths
1,236
Sq Ft
$220/Sq Ft
Est. Value
About This Home
This home is located at 1331 Maple Rd, Southport, NC 28461 and is currently estimated at $272,004, approximately $220 per square foot. 1331 Maple Rd is a home located in Brunswick County with nearby schools including Bolivia Elementary School, South Brunswick Middle School, and South Brunswick High School.
Ownership History
Date
Name
Owned For
Owner Type
Purchase Details
Closed on
Oct 27, 2009
Sold by
Cruse Travis D and Cruse Susan A
Bought by
Honeycutt
Current Estimated Value
Home Financials for this Owner
Home Financials are based on the most recent Mortgage that was taken out on this home.
Original Mortgage
$148,818
Outstanding Balance
$97,073
Interest Rate
4.98%
Mortgage Type
New Conventional
Estimated Equity
$174,931
Create a Home Valuation Report for This Property
The Home Valuation Report is an in-depth analysis detailing your home's value as well as a comparison with similar homes in the area
Home Values in the Area
Average Home Value in this Area
Purchase History
| Date | Buyer | Sale Price | Title Company |
|---|---|---|---|
| Honeycutt | $146,000 | None Available |
Source: Public Records
Mortgage History
| Date | Status | Borrower | Loan Amount |
|---|---|---|---|
| Open | Honeycutt | $148,818 |
Source: Public Records
Tax History
| Year | Tax Paid | Tax Assessment Tax Assessment Total Assessment is a certain percentage of the fair market value that is determined by local assessors to be the total taxable value of land and additions on the property. | Land | Improvement |
|---|---|---|---|---|
| 2025 | $1,513 | $246,720 | $14,000 | $232,720 |
| 2024 | $15 | $246,720 | $14,000 | $232,720 |
| 2023 | $1,341 | $246,720 | $14,000 | $232,720 |
| 2022 | $1,341 | $155,060 | $11,000 | $144,060 |
| 2021 | $1,327 | $155,060 | $11,000 | $144,060 |
| 2020 | $1,246 | $155,060 | $11,000 | $144,060 |
| 2019 | $1,246 | $24,120 | $11,000 | $13,120 |
| 2018 | $1,052 | $24,170 | $10,000 | $14,170 |
| 2017 | $1,026 | $24,170 | $10,000 | $14,170 |
| 2016 | $1,001 | $24,170 | $10,000 | $14,170 |
| 2015 | $993 | $128,480 | $10,000 | $118,480 |
| 2014 | $953 | $139,197 | $23,000 | $116,197 |
Source: Public Records
Map
Nearby Homes
- 1 Maple Rd
- Lot 24 Maple Rd
- 1230 Juniper Rd
- 1210 Grace Rd
- 1178 Grace Rd
- Lot 576 Juniper Rd
- 1893 Juniper Rd
- 1120 Beech Rd
- .73 Acres Beech Rd
- 1695 Beech Rd
- 1773 Beech Rd
- 371 & 381 Elm
- 286 Elm St
- 172 Cherry Rd
- 253 Sycamore Rd
- L-70&L-71 Sweet Briar Rd
- 1469 E Boiling Spring Rd
- 1481 E Boiling Spring Rd
- 1360 Bobolink Rd
- 1400 Bobolink Rd
Your Personal Tour Guide
Ask me questions while you tour the home.