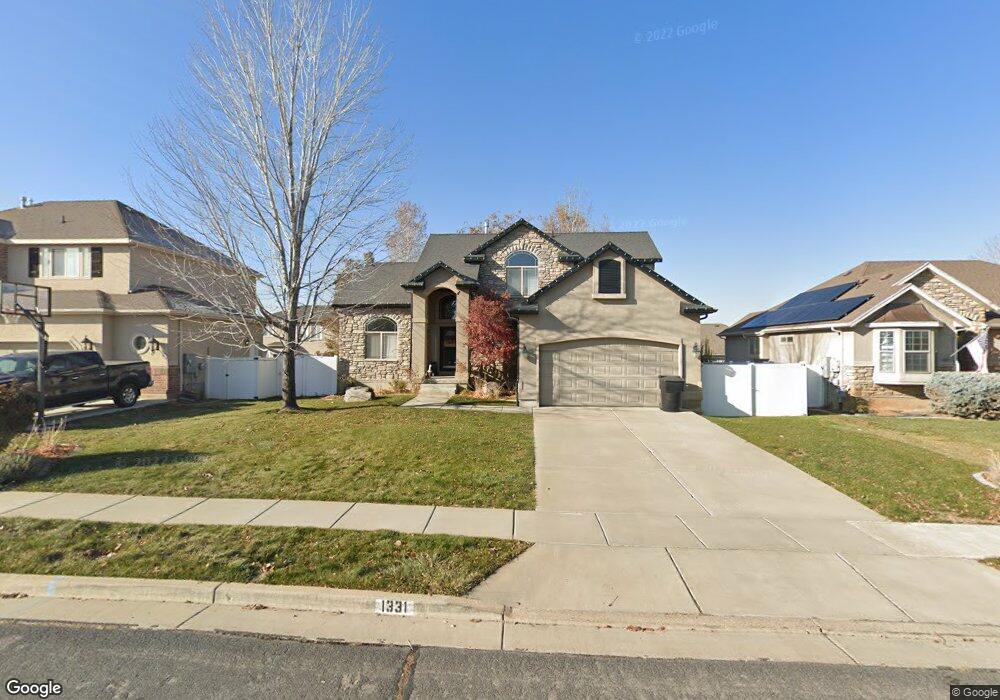
1331 N 2090 W Clearfield, UT 84015
Estimated Value: $533,000 - $585,000
5
Beds
3
Baths
3,453
Sq Ft
$164/Sq Ft
Est. Value
About This Home
This home is located at 1331 N 2090 W, Clearfield, UT 84015 and is currently estimated at $567,318, approximately $164 per square foot. 1331 N 2090 W is a home located in Davis County with nearby schools including Parkside Elementary School, West Point Junior High School, and Clearfield High School.
Ownership History
Date
Name
Owned For
Owner Type
Purchase Details
Closed on
Aug 22, 2024
Sold by
Swapp Lynn Dell
Bought by
Ld Swapp Investment Trust and Burroughs
Current Estimated Value
Purchase Details
Closed on
May 11, 2007
Sold by
Simmons James and Simmons Maxine
Bought by
Lowman Breen D and Lowman Tamara A
Home Financials for this Owner
Home Financials are based on the most recent Mortgage that was taken out on this home.
Original Mortgage
$285,246
Interest Rate
6.14%
Mortgage Type
VA
Purchase Details
Closed on
Aug 3, 2005
Sold by
Simmons James F and Simmons Maxine H
Bought by
Simmons James and Simmons Maxine
Purchase Details
Closed on
Sep 10, 2004
Sold by
North Ivory
Bought by
Simmons James F and Simmons Maxine H
Create a Home Valuation Report for This Property
The Home Valuation Report is an in-depth analysis detailing your home's value as well as a comparison with similar homes in the area
Home Values in the Area
Average Home Value in this Area
Purchase History
| Date | Buyer | Sale Price | Title Company |
|---|---|---|---|
| Ld Swapp Investment Trust | -- | None Listed On Document | |
| Lowman Breen D | -- | Backman Title Services | |
| Simmons James | -- | -- | |
| Simmons James F | -- | Bonneville Title Company Inc | |
| North Ivory | -- | Bonneville Title Company Inc |
Source: Public Records
Mortgage History
| Date | Status | Borrower | Loan Amount |
|---|---|---|---|
| Previous Owner | Lowman Breen D | $285,246 |
Source: Public Records
Tax History Compared to Growth
Tax History
| Year | Tax Paid | Tax Assessment Tax Assessment Total Assessment is a certain percentage of the fair market value that is determined by local assessors to be the total taxable value of land and additions on the property. | Land | Improvement |
|---|---|---|---|---|
| 2025 | $2,946 | $283,251 | $83,254 | $199,997 |
| 2024 | $2,817 | $272,250 | $92,218 | $180,032 |
| 2023 | $2,801 | $501,000 | $103,688 | $397,312 |
| 2022 | $2,985 | $295,350 | $64,945 | $230,405 |
| 2021 | $2,800 | $411,000 | $78,745 | $332,255 |
| 2020 | $2,444 | $355,000 | $65,591 | $289,409 |
| 2019 | $2,382 | $338,000 | $79,110 | $258,890 |
| 2018 | $2,238 | $312,000 | $59,388 | $252,612 |
| 2016 | $2,017 | $145,200 | $28,553 | $116,647 |
| 2015 | $1,979 | $135,465 | $28,553 | $106,912 |
| 2014 | $1,660 | $115,445 | $28,553 | $86,892 |
| 2013 | -- | $136,343 | $29,221 | $107,122 |
Source: Public Records
Map
Nearby Homes