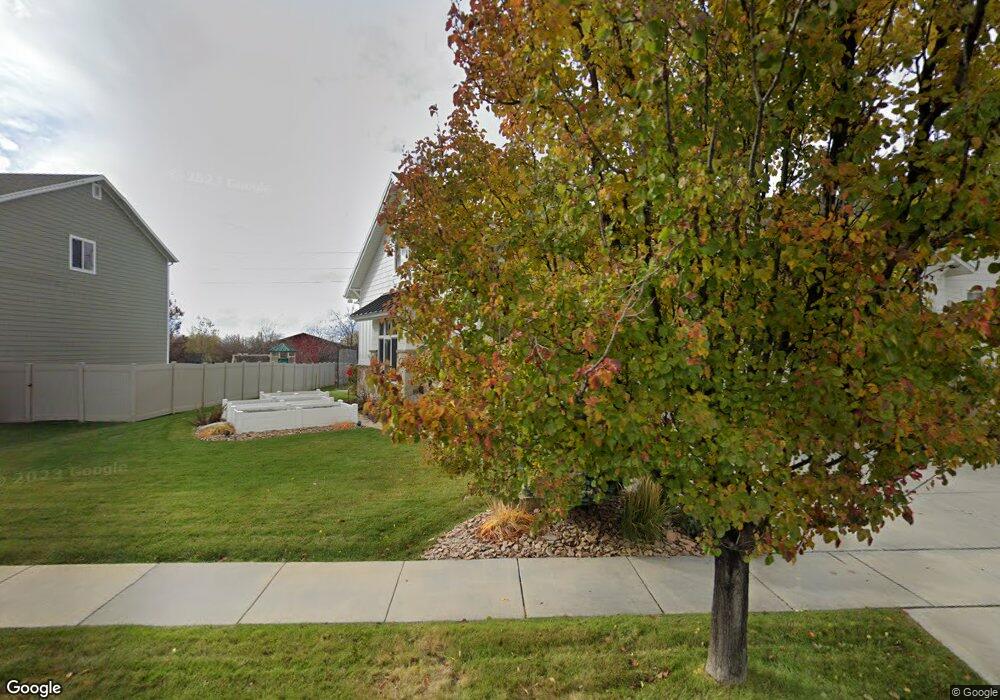
1331 N 840 W West Bountiful, UT 84087
Estimated Value: $923,000 - $1,748,000
4
Beds
4
Baths
4,430
Sq Ft
$297/Sq Ft
Est. Value
About This Home
This home is located at 1331 N 840 W, West Bountiful, UT 84087 and is currently estimated at $1,317,531, approximately $297 per square foot. 1331 N 840 W is a home with nearby schools including West Bountiful Elementary School, Bountiful Junior High School, and Viewmont High School.
Ownership History
Date
Name
Owned For
Owner Type
Purchase Details
Closed on
Feb 27, 2015
Sold by
Shupe Travis G and Shupe Susie
Bought by
Shupe Travis Grant
Current Estimated Value
Purchase Details
Closed on
Apr 10, 2012
Sold by
Shupe Travis G
Bought by
Shupe Travis G and Shupe Susie
Home Financials for this Owner
Home Financials are based on the most recent Mortgage that was taken out on this home.
Original Mortgage
$275,000
Interest Rate
3.86%
Mortgage Type
New Conventional
Purchase Details
Closed on
Oct 30, 2009
Sold by
Stanley Larry E and Stanley Elizabeth J R
Bought by
Shupe Travis G
Purchase Details
Closed on
Sep 22, 2006
Sold by
Triple S Development Inc
Bought by
Stanley Larry E and Stanley Elizabeth J R
Create a Home Valuation Report for This Property
The Home Valuation Report is an in-depth analysis detailing your home's value as well as a comparison with similar homes in the area
Home Values in the Area
Average Home Value in this Area
Purchase History
| Date | Buyer | Sale Price | Title Company |
|---|---|---|---|
| Shupe Travis Grant | -- | Attorney | |
| Shupe Travis G | -- | Aspen Title Insuranc | |
| Shupe Travis G | -- | None Available | |
| Stanley Larry E | -- | Aspen Title Insurance Agency |
Source: Public Records
Mortgage History
| Date | Status | Borrower | Loan Amount |
|---|---|---|---|
| Previous Owner | Shupe Travis G | $275,000 |
Source: Public Records
Tax History Compared to Growth
Tax History
| Year | Tax Paid | Tax Assessment Tax Assessment Total Assessment is a certain percentage of the fair market value that is determined by local assessors to be the total taxable value of land and additions on the property. | Land | Improvement |
|---|---|---|---|---|
| 2025 | $7,727 | $679,250 | $180,346 | $498,904 |
| 2024 | $6,651 | $591,800 | $149,593 | $442,207 |
| 2023 | $6,572 | $1,070,000 | $273,900 | $796,100 |
| 2022 | $6,628 | $603,350 | $138,666 | $464,684 |
| 2021 | $6,463 | $905,000 | $201,429 | $703,571 |
| 2020 | $5,842 | $808,000 | $175,545 | $632,455 |
| 2019 | $6,017 | $824,000 | $168,585 | $655,415 |
| 2018 | $5,731 | $773,000 | $156,452 | $616,548 |
| 2016 | $4,955 | $359,700 | $5,392 | $354,308 |
| 2015 | $5,129 | $352,990 | $5,392 | $347,598 |
| 2014 | $4,458 | $311,564 | $5,392 | $306,172 |
| 2013 | -- | $233,750 | $50,164 | $183,586 |
Source: Public Records
Map
Nearby Homes
- 825 W 1320 N
- 1084 W Audrey Ln Unit 20
- 1084 W Audrey Ln
- 789 W 1950 N
- 988 W 1950 N Unit 134
- 2035 N 800 W
- 1520 N 550 W
- 2257 N 830 W
- Hampton Traditional Plan at Belmont Farms
- 790 N 500 W
- 366 W 1000 N
- 580 W 2125 N
- 767 W 220 N
- 280 N 1100 W
- 1503 N 300 W
- 2339 N 800 W
- 235 W 1400 N
- 340 N 500 W Unit 204
- 399 W 400 N Unit 47
- 239 Lyman Ln
- 1319 N 840 W
- 1311 N 840 W
- 836 W 1320 N
- 837 W 1320 N
- 837 W 1320 N Unit 5
- 1348 N 840 W
- 830 W 1320 N Unit 12
- 830 W 1320 N
- 1402 Willowbrook Dr
- 831 W 1320 N
- 824 W 1320 N
- 1422 Willowbrook Dr
- 1347 N 800 W
- 1395 N 840 W
- 825 W 1320 N Unit 3
- 1380 N 840 W
- 1442 Willowbrook Dr
- 1390 N 840 W
- 1415 N 840 W
- 817 W 1320 N