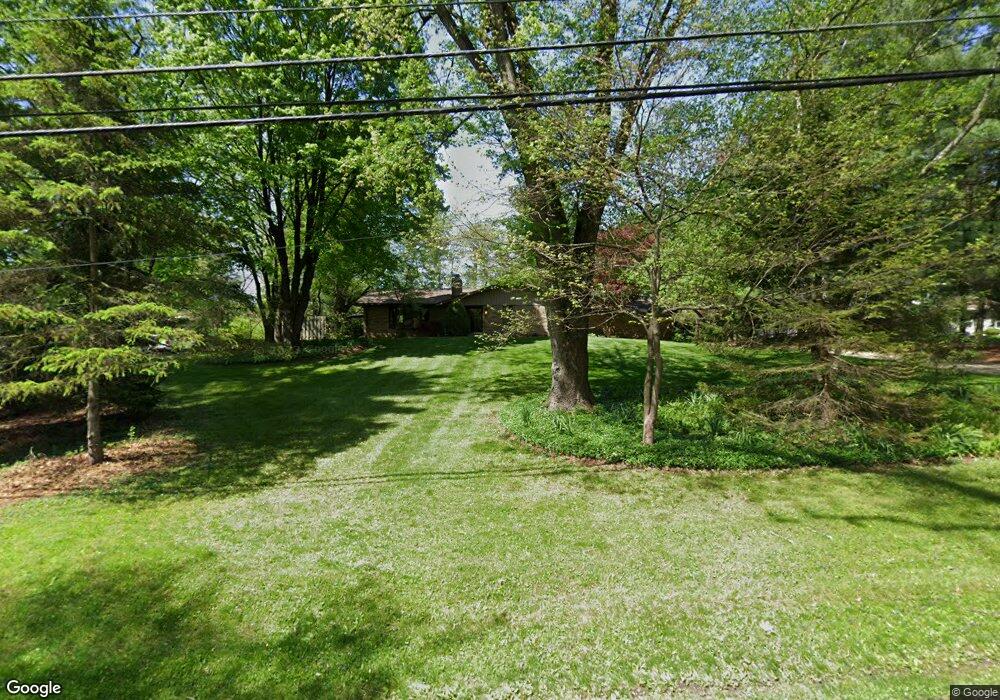
1331 Park Rd Mount Vernon, OH 43050
Estimated Value: $319,000 - $400,000
3
Beds
3
Baths
1,630
Sq Ft
$216/Sq Ft
Est. Value
About This Home
This home is located at 1331 Park Rd, Mount Vernon, OH 43050 and is currently estimated at $352,648, approximately $216 per square foot. 1331 Park Rd is a home located in Knox County with nearby schools including Mount Vernon High School, St. Vincent de Paul School, and Christian Star Academy.
Ownership History
Date
Name
Owned For
Owner Type
Purchase Details
Closed on
Jul 29, 2015
Sold by
Mickley Thomas B and Mickley Dorothy N
Bought by
Mickley Jordan T
Current Estimated Value
Purchase Details
Closed on
Jul 27, 1998
Sold by
Culbertson David T and El M
Bought by
Mickley Thomas B and Mickley Doroth
Purchase Details
Closed on
Oct 30, 1997
Sold by
Schendel Harry A
Bought by
Culbertson David T and Culbertson El M
Purchase Details
Closed on
Aug 17, 1994
Sold by
Schendel Harry A and Schendel Che
Bought by
Schendel Harry A
Purchase Details
Closed on
Jun 12, 1987
Sold by
Mckenzie Marion F and Mckenzie Mary
Bought by
Schendel Harry A and Schendel Che
Create a Home Valuation Report for This Property
The Home Valuation Report is an in-depth analysis detailing your home's value as well as a comparison with similar homes in the area
Home Values in the Area
Average Home Value in this Area
Purchase History
| Date | Buyer | Sale Price | Title Company |
|---|---|---|---|
| Mickley Jordan T | -- | None Available | |
| Mickley Thomas B | $136,000 | -- | |
| Culbertson David T | $100,000 | -- | |
| Schendel Harry A | -- | -- | |
| Schendel Harry A | $91,800 | -- |
Source: Public Records
Tax History Compared to Growth
Tax History
| Year | Tax Paid | Tax Assessment Tax Assessment Total Assessment is a certain percentage of the fair market value that is determined by local assessors to be the total taxable value of land and additions on the property. | Land | Improvement |
|---|---|---|---|---|
| 2024 | $3,970 | $102,960 | $16,920 | $86,040 |
| 2023 | $3,970 | $102,960 | $16,920 | $86,040 |
| 2022 | $3,353 | $79,190 | $13,010 | $66,180 |
| 2021 | $3,353 | $79,190 | $13,010 | $66,180 |
| 2020 | $3,266 | $79,190 | $13,010 | $66,180 |
| 2019 | $2,880 | $65,090 | $14,050 | $51,040 |
| 2018 | $2,880 | $65,090 | $14,050 | $51,040 |
| 2017 | $2,829 | $65,090 | $14,050 | $51,040 |
| 2016 | $2,624 | $60,270 | $13,010 | $47,260 |
| 2015 | $2,635 | $60,270 | $13,010 | $47,260 |
| 2014 | $2,649 | $60,270 | $13,010 | $47,260 |
| 2013 | $2,801 | $60,770 | $12,680 | $48,090 |
Source: Public Records
Map
Nearby Homes