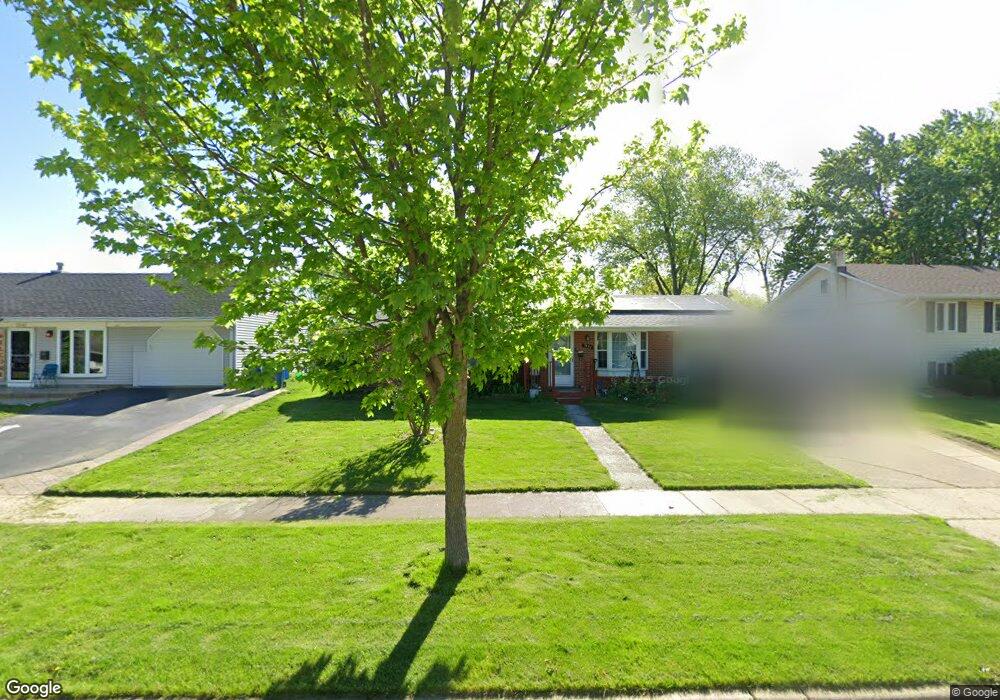
1331 Post Rd Aurora, IL 60506
North River NeighborhoodEstimated Value: $266,214 - $345,000
Studio
--
Bath
1,651
Sq Ft
$184/Sq Ft
Est. Value
About This Home
This home is located at 1331 Post Rd, Aurora, IL 60506 and is currently estimated at $303,554, approximately $183 per square foot. 1331 Post Rd is a home located in Kane County with nearby schools including Smith Elementary School, Jewel Middle School, and West Aurora High School.
Ownership History
Date
Name
Owned For
Owner Type
Purchase Details
Closed on
Aug 25, 2021
Sold by
Debolt Christopher Scott and Debolt Sue Ellen
Bought by
Debolt Christopher S and Debolt Sue E
Current Estimated Value
Purchase Details
Closed on
Feb 22, 2021
Sold by
Debolt Christopher Scott and Debolt Sue Ellen
Bought by
Debolt Christopher Scott and Debolt Sue Ellen
Purchase Details
Closed on
Mar 17, 2017
Sold by
Debolt Christopher Scott and Debolt Sue Ellen
Bought by
Debolt Christopher S and Debolt Sue E
Purchase Details
Closed on
Nov 21, 2001
Sold by
Tesch Sue Ellen and Debolt Sue Ellen
Bought by
Debolt Christopher Scott and Debolt Sue Ellen
Home Financials for this Owner
Home Financials are based on the most recent Mortgage that was taken out on this home.
Original Mortgage
$91,000
Interest Rate
6.64%
Create a Home Valuation Report for This Property
The Home Valuation Report is an in-depth analysis detailing your home's value as well as a comparison with similar homes in the area
Home Values in the Area
Average Home Value in this Area
Purchase History
| Date | Buyer | Sale Price | Title Company |
|---|---|---|---|
| Debolt Christopher S | -- | Attorney | |
| Debolt Christopher Scott | -- | None Available | |
| Debolt Christopher S | -- | None Available | |
| Debolt Christopher Scott | -- | Chicago Title Insurance Co |
Source: Public Records
Mortgage History
| Date | Status | Borrower | Loan Amount |
|---|---|---|---|
| Closed | Debolt Christopher Scott | $91,000 |
Source: Public Records
Tax History
| Year | Tax Paid | Tax Assessment Tax Assessment Total Assessment is a certain percentage of the fair market value that is determined by local assessors to be the total taxable value of land and additions on the property. | Land | Improvement |
|---|---|---|---|---|
| 2024 | $5,735 | $80,426 | $15,912 | $64,514 |
| 2023 | $5,470 | $71,860 | $14,217 | $57,643 |
| 2022 | $5,273 | $65,566 | $12,972 | $52,594 |
| 2021 | $5,029 | $61,043 | $12,077 | $48,966 |
| 2020 | $5,338 | $63,016 | $11,218 | $51,798 |
| 2019 | $5,123 | $58,386 | $10,394 | $47,992 |
| 2018 | $4,801 | $54,087 | $9,614 | $44,473 |
| 2017 | $4,394 | $48,695 | $8,858 | $39,837 |
| 2016 | $4,247 | $45,980 | $7,593 | $38,387 |
| 2015 | -- | $39,970 | $6,529 | $33,441 |
| 2014 | -- | $38,441 | $6,279 | $32,162 |
| 2013 | -- | $39,069 | $6,190 | $32,879 |
Source: Public Records
Map
Nearby Homes
- 1080 Scarlet Oak Cir
- 847 Foran Ln
- 837 Taylor Ave
- 461 Sullivan Rd
- 833 Sheldon Ave
- 1387 S Glen Cir Unit D
- 732 N Fordham Ave
- 833 N Randall Rd Unit C4
- 338 Lakelawn Blvd
- 1039 S Pleasure Ct
- 1061 S Pleasure Ct
- 418 W Illinois Ave
- 603 N May St
- 424 N Lancaster Ave
- 991 Sapphire Ln
- 959 Sapphire Ln
- 975 Sapphire Ln
- 963 Sapphire Ln
- 987 Sapphire Ln
- 1815 Brighton Cir
- 1321 Post Rd
- 1341 Post Rd
- 1330 Durham Dr Unit 1
- 1305 Post Rd
- 1340 Durham Dr
- 1320 Durham Dr Unit 1
- 880 Upper Brandon Dr
- 1330 Post Rd
- 1285 Post Rd
- 1340 Post Rd
- 1320 Post Rd Unit 1
- 1310 Durham Dr
- 1350 Post Rd
- 1310 Post Rd
- 1275 Post Rd
- 1290 Post Rd
- 1300 Durham Dr
- 934 Upper Brandon Dr Unit 2
- 1321 Foran Ln
- 1331 Foran Ln
Your Personal Tour Guide
Ask me questions while you tour the home.