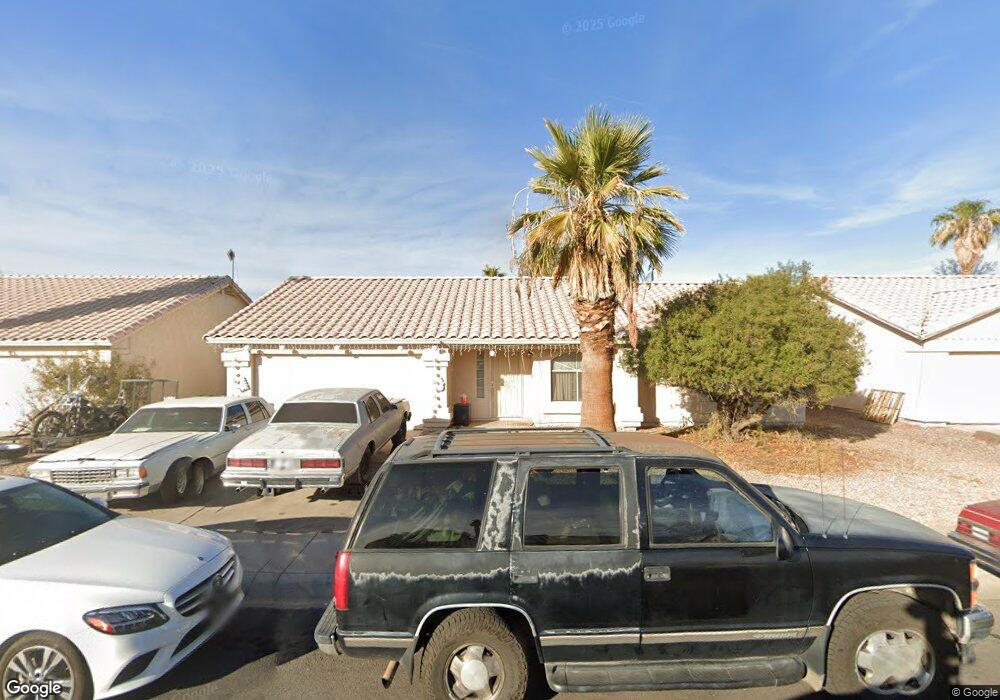
13310 E Butler St Chandler, AZ 85225
East Chandler NeighborhoodEstimated Value: $376,735 - $454,000
--
Bed
2
Baths
1,300
Sq Ft
$330/Sq Ft
Est. Value
About This Home
This home is located at 13310 E Butler St, Chandler, AZ 85225 and is currently estimated at $429,434, approximately $330 per square foot. 13310 E Butler St is a home located in Maricopa County with nearby schools including Chandler Traditional Academy-Humphrey, Willis Junior High School, and BASIS Chandler Primary North Campus.
Ownership History
Date
Name
Owned For
Owner Type
Purchase Details
Closed on
Mar 23, 1999
Sold by
Nelson Clyde E and Nelson Helvi H
Bought by
Nelson Ronald A
Current Estimated Value
Home Financials for this Owner
Home Financials are based on the most recent Mortgage that was taken out on this home.
Original Mortgage
$85,000
Outstanding Balance
$20,976
Interest Rate
6.98%
Estimated Equity
$408,458
Purchase Details
Closed on
May 5, 1995
Sold by
Providence Homes Inc
Bought by
Nelson Ronald A and Nelson Clyde E
Home Financials for this Owner
Home Financials are based on the most recent Mortgage that was taken out on this home.
Original Mortgage
$84,254
Interest Rate
8.47%
Mortgage Type
FHA
Purchase Details
Closed on
Feb 24, 1995
Sold by
Security Title Agency
Bought by
Providence Development Inc
Purchase Details
Closed on
May 11, 1994
Sold by
Providence Development Inc
Bought by
Providence Homes Inc
Create a Home Valuation Report for This Property
The Home Valuation Report is an in-depth analysis detailing your home's value as well as a comparison with similar homes in the area
Home Values in the Area
Average Home Value in this Area
Purchase History
| Date | Buyer | Sale Price | Title Company |
|---|---|---|---|
| Nelson Ronald A | -- | Capital Title Agency | |
| Nelson Ronald A | $84,859 | Security Title Agency | |
| Providence Development Inc | $15,000 | Security Title Agency | |
| Providence Homes Inc | $67,548 | Security Title Agency |
Source: Public Records
Mortgage History
| Date | Status | Borrower | Loan Amount |
|---|---|---|---|
| Open | Nelson Ronald A | $85,000 | |
| Closed | Nelson Ronald A | $84,254 |
Source: Public Records
Tax History Compared to Growth
Tax History
| Year | Tax Paid | Tax Assessment Tax Assessment Total Assessment is a certain percentage of the fair market value that is determined by local assessors to be the total taxable value of land and additions on the property. | Land | Improvement |
|---|---|---|---|---|
| 2025 | $1,643 | $16,011 | -- | -- |
| 2024 | $1,558 | $15,248 | -- | -- |
| 2023 | $1,558 | $30,350 | $6,070 | $24,280 |
| 2022 | $1,489 | $22,050 | $4,410 | $17,640 |
| 2021 | $1,535 | $21,420 | $4,280 | $17,140 |
| 2020 | $1,536 | $19,360 | $3,870 | $15,490 |
| 2019 | $1,488 | $17,410 | $3,480 | $13,930 |
| 2018 | $1,448 | $15,910 | $3,180 | $12,730 |
| 2017 | $1,369 | $14,430 | $2,880 | $11,550 |
| 2016 | $1,290 | $14,420 | $2,880 | $11,540 |
| 2015 | $1,253 | $14,330 | $2,860 | $11,470 |
Source: Public Records
Map
Nearby Homes
- 76 N 133rd St
- 15802 S Gilbert Rd Unit 58
- 6 S 132nd St
- 2214 E Frye Rd
- 15606 S Gilbert Rd Unit 128
- 28 E Joseph Way
- 25 N Cottonwood St Unit 41
- 252 N Wilson Dr
- 2253 E Kempton Rd
- 75 E Elgin St
- 195 N Cottonwood St Unit 21
- 2691 E Hulet Dr
- 2660 E Hulet Dr
- 194 E Canyon Creek Dr
- 2480 E Stephens Place
- 333 S Cooper Rd
- 13640 E Williams Field Rd
- 272 E Joseph Way
- 505 S Soho Ln Unit 30
- 2600 E Springfield Place Unit 64
- 13314 E Butler St
- 13306 E Butler St
- 13309 E Jupiter Way
- 13313 E Jupiter Way
- 13305 E Jupiter Way
- 13318 E Butler St
- 13311 E Butler St
- 13317 E Jupiter Way
- 13315 E Butler St
- 13307 E Butler St
- 13322 E Butler St
- 13319 E Butler St
- 13321 E Jupiter Way
- 13323 E Butler St
- 13310 E Jupiter Way
- 13312 E Chicago St
- 13326 E Butler St
- 13308 E Chicago St
- 13314 E Jupiter Way
- 13306 E Jupiter Way