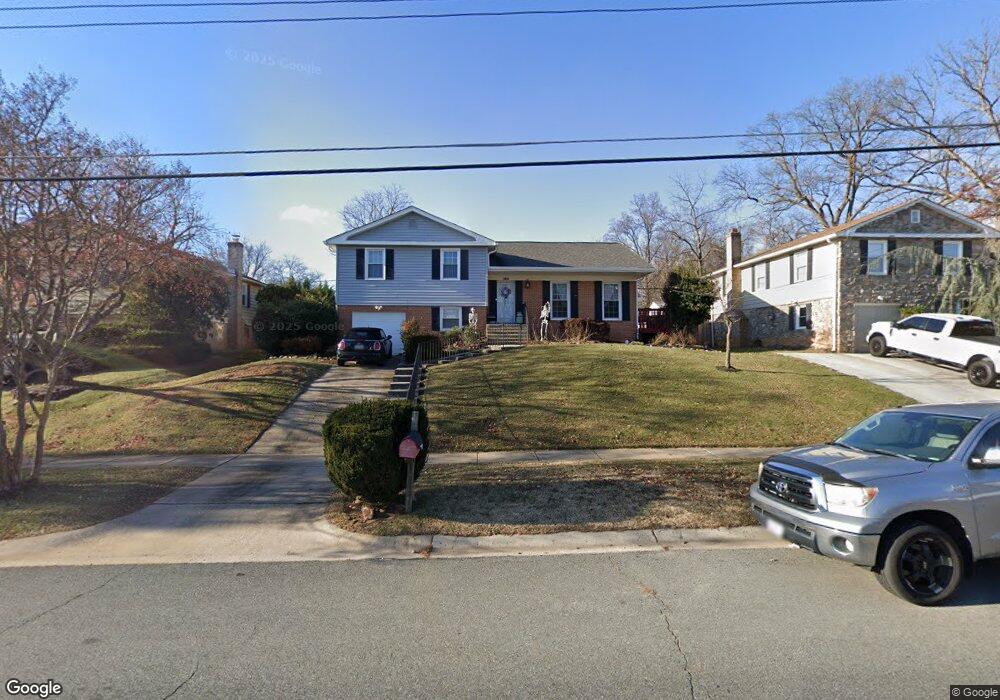
13316 Tamarack Rd Silver Spring, MD 20904
Estimated Value: $591,590 - $680,000
Studio
3
Baths
2,560
Sq Ft
$250/Sq Ft
Est. Value
About This Home
This home is located at 13316 Tamarack Rd, Silver Spring, MD 20904 and is currently estimated at $639,398, approximately $249 per square foot. 13316 Tamarack Rd is a home located in Montgomery County with nearby schools including William Tyler Page Elementary School, Briggs Chaney Middle School, and James Hubert Blake High School.
Ownership History
Date
Name
Owned For
Owner Type
Purchase Details
Closed on
Apr 27, 2018
Sold by
Slade Michael D and Slade Sheri D
Bought by
Slade Michael D
Current Estimated Value
Home Financials for this Owner
Home Financials are based on the most recent Mortgage that was taken out on this home.
Original Mortgage
$402,429
Outstanding Balance
$346,505
Interest Rate
4.4%
Mortgage Type
FHA
Estimated Equity
$292,893
Purchase Details
Closed on
Nov 8, 2005
Sold by
Slade Mazy D Et Al Tr
Bought by
Slade Michael D and Slade Sheri D
Purchase Details
Closed on
Oct 14, 2005
Sold by
Slade Mazy D Et Al Tr
Bought by
Slade Michael D and Slade Sheri D
Purchase Details
Closed on
Jun 5, 2002
Sold by
Slade William C and Slade D M
Bought by
Slade Mazy D Et Al Tr
Create a Home Valuation Report for This Property
The Home Valuation Report is an in-depth analysis detailing your home's value as well as a comparison with similar homes in the area
Home Values in the Area
Average Home Value in this Area
Purchase History
We collect this data history from publicly available records. To have your information removed, we recommend requesting removal directly through your county’s website.
| Date | Buyer | Sale Price | Title Company |
|---|---|---|---|
| Slade Michael D | -- | None Available | |
| Slade Michael D | $378,000 | -- | |
| Slade Michael D | $378,000 | -- | |
| Slade Michael D | $378,000 | -- | |
| Slade Michael D | $378,000 | -- | |
| Slade Mazy D Et Al Tr | -- | -- |
Source: Public Records
Mortgage History
We collect this data history from publicly available records. To have your information removed, we recommend requesting removal directly through your county’s website.
| Date | Status | Borrower | Loan Amount |
|---|---|---|---|
| Open | Slade Michael D | $402,429 |
Source: Public Records
Tax History
| Year | Tax Paid | Tax Assessment Tax Assessment Total Assessment is a certain percentage of the fair market value that is determined by local assessors to be the total taxable value of land and additions on the property. | Land | Improvement |
|---|---|---|---|---|
| 2025 | $6,289 | $529,667 | -- | -- |
| 2024 | $6,289 | $493,533 | $0 | $0 |
| 2023 | $5,157 | $457,400 | $219,200 | $238,200 |
| 2022 | $4,595 | $430,700 | $0 | $0 |
| 2021 | $3,908 | $404,000 | $0 | $0 |
| 2020 | $3,908 | $377,300 | $219,200 | $158,100 |
| 2019 | $3,764 | $366,733 | $0 | $0 |
| 2018 | $3,629 | $356,167 | $0 | $0 |
| 2017 | $3,575 | $345,600 | $0 | $0 |
| 2016 | $3,922 | $340,033 | $0 | $0 |
| 2015 | $3,922 | $334,467 | $0 | $0 |
| 2014 | $3,922 | $328,900 | $0 | $0 |
Source: Public Records
Map
Nearby Homes
- 1319 Smith Village Rd
- 13408 Brackley Terrace
- 1109 Crowfoot Ln
- 1211 Morningside Dr
- 13017 Broadmore Rd
- 1421 Morningside Dr
- 1932 Olivine Ct
- 0 Copley Ln
- 13001 Buccaneer Rd
- 702 Buccaneer Ct
- 3092 Fairland Rd
- 13608 Creekside Dr
- 816 Rosemere Ave
- 616 Chichester Ln
- 2124 Aventurine Way
- 803 Johnson Ave
- 2205 Blue Valley Dr
- 2213 Aventurine Way
- 12754 Turquoise Terrace
- 810 Venice Dr
- 13314 Tamarack Rd
- 13318 Tamarack Rd
- 1440 Smith Village Rd
- 13312 Tamarack Rd
- 1430 Smith Village Rd
- 13315 Tamarack Rd
- 13317 Tamarack Rd
- 13313 Tamarack Rd
- 13310 Tamarack Rd
- 13311 Tamarack Rd
- 13319 Tamarack Rd
- 1400 Smith Village Rd
- 13309 Tamarack Rd
- 1507 Lemontree Ln
- 1401 Northcrest Dr
- 13308 Tamarack Rd
- 1505 Lemontree Ln
- 1509 Lemontree Ln
- 1415 Smith Village Rd
- 1503 Lemontree Ln
Your Personal Tour Guide
Ask me questions while you tour the home.