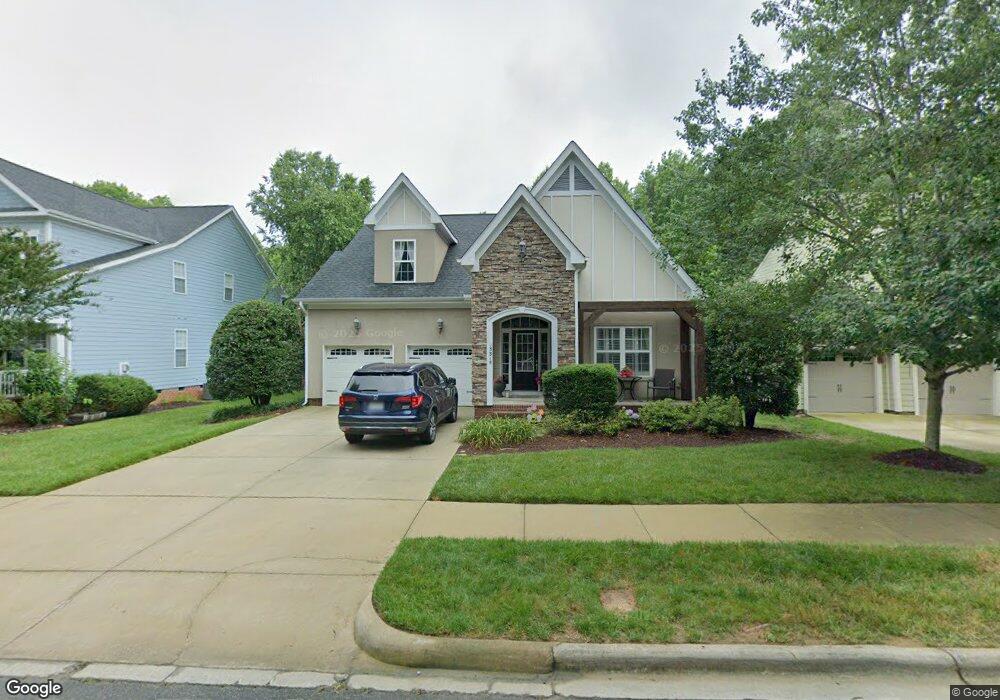
13318 Pierre Reverdy Dr Davidson, NC 28036
Estimated Value: $567,000 - $742,000
4
Beds
3
Baths
2,555
Sq Ft
$246/Sq Ft
Est. Value
About This Home
This home is located at 13318 Pierre Reverdy Dr, Davidson, NC 28036 and is currently estimated at $629,408, approximately $246 per square foot. 13318 Pierre Reverdy Dr is a home located in Mecklenburg County with nearby schools including Davidson Elementary School, William Amos Hough High School, and Lakeside Charter Academy.
Ownership History
Date
Name
Owned For
Owner Type
Purchase Details
Closed on
Oct 14, 2010
Sold by
Leahy Timothy N
Bought by
Holbrook Brian K and Holbrook Rebecca C
Current Estimated Value
Home Financials for this Owner
Home Financials are based on the most recent Mortgage that was taken out on this home.
Original Mortgage
$253,409
Interest Rate
4.4%
Mortgage Type
FHA
Purchase Details
Closed on
Aug 28, 2009
Sold by
Leahy Timothy N and Leahy Angela M
Bought by
Leahy Timothy N and Leahy Angela M
Purchase Details
Closed on
Jan 28, 2005
Sold by
Neighborhoods At Bradford Inc
Bought by
Leahy Timothy N and Leahy Angela M
Home Financials for this Owner
Home Financials are based on the most recent Mortgage that was taken out on this home.
Original Mortgage
$210,392
Interest Rate
5.12%
Mortgage Type
Purchase Money Mortgage
Create a Home Valuation Report for This Property
The Home Valuation Report is an in-depth analysis detailing your home's value as well as a comparison with similar homes in the area
Home Values in the Area
Average Home Value in this Area
Purchase History
| Date | Buyer | Sale Price | Title Company |
|---|---|---|---|
| Holbrook Brian K | $260,000 | None Available | |
| Leahy Timothy N | -- | None Available | |
| Leahy Timothy N | $263,000 | -- |
Source: Public Records
Mortgage History
| Date | Status | Borrower | Loan Amount |
|---|---|---|---|
| Previous Owner | Holbrook Brian K | $253,409 | |
| Previous Owner | Leahy Timothy N | $210,392 | |
| Closed | Leahy Timothy N | $26,299 |
Source: Public Records
Tax History Compared to Growth
Tax History
| Year | Tax Paid | Tax Assessment Tax Assessment Total Assessment is a certain percentage of the fair market value that is determined by local assessors to be the total taxable value of land and additions on the property. | Land | Improvement |
|---|---|---|---|---|
| 2025 | $3,498 | $460,300 | $120,000 | $340,300 |
| 2024 | $3,498 | $460,300 | $120,000 | $340,300 |
| 2023 | $3,447 | $460,300 | $120,000 | $340,300 |
| 2022 | $2,581 | $269,800 | $60,000 | $209,800 |
| 2021 | $2,687 | $269,800 | $60,000 | $209,800 |
| 2020 | $2,687 | $274,400 | $60,000 | $214,400 |
| 2019 | $2,723 | $274,400 | $60,000 | $214,400 |
| 2018 | $2,745 | $214,500 | $50,000 | $164,500 |
| 2017 | $2,725 | $214,500 | $50,000 | $164,500 |
| 2016 | $2,722 | $214,500 | $50,000 | $164,500 |
| 2015 | $2,718 | $214,500 | $50,000 | $164,500 |
| 2014 | $2,716 | $0 | $0 | $0 |
Source: Public Records
Map
Nearby Homes
- 13112 Appolinaire Dr
- 20017 Metaphor Mews None
- 12932 Westmoreland Farm Rd
- 10922 Zac Hill Rd
- 11220 Westbranch Pkwy
- 11610 Westbranch Pkwy
- 11304 Westbranch Pkwy
- 13820 E Rocky River Rd
- 13820 E Rocky River Rd Unit 1
- 19320 Davidson Concord Rd
- 12020 Westbranch Pkwy
- 19134 Newburg Hill Rd
- 1425 Samuel Spencer Pkwy Unit 5
- 239 Kimberly Rd
- 547 Ashby Dr
- 920 Hudson Place
- 1413 Samuel Spencer Pkwy Unit 3
- 707 Hudson Place
- High Rock Plan at Davidson Woods
- Hickory Plan at Davidson Woods
- 13314 Pierre Reverdy Dr
- 13322 Pierre Reverdy Dr
- 13310 Pierre Reverdy Dr
- 13326 Pierre Reverdy Dr
- 13306 Pierre Reverdy Dr
- 13319 Pierre Reverdy Dr
- 13330 Pierre Reverdy Dr
- 13315 Pierre Reverdy Dr
- 13323 Pierre Reverdy Dr
- 13311 Pierre Reverdy Dr
- 13327 Pierre Reverdy Dr
- 13302 Pierre Reverdy Dr
- 13307 Pierre Reverdy Dr
- 13331 Pierre Reverdy Dr
- 13303 Pierre Reverdy Dr
- 13338 Pierre Reverdy Dr
- 13335 Pierre Reverdy Dr
- 13339 Pierre Reverdy Dr
- 13141 Appolinaire Dr
- 13201 Appolinaire Dr