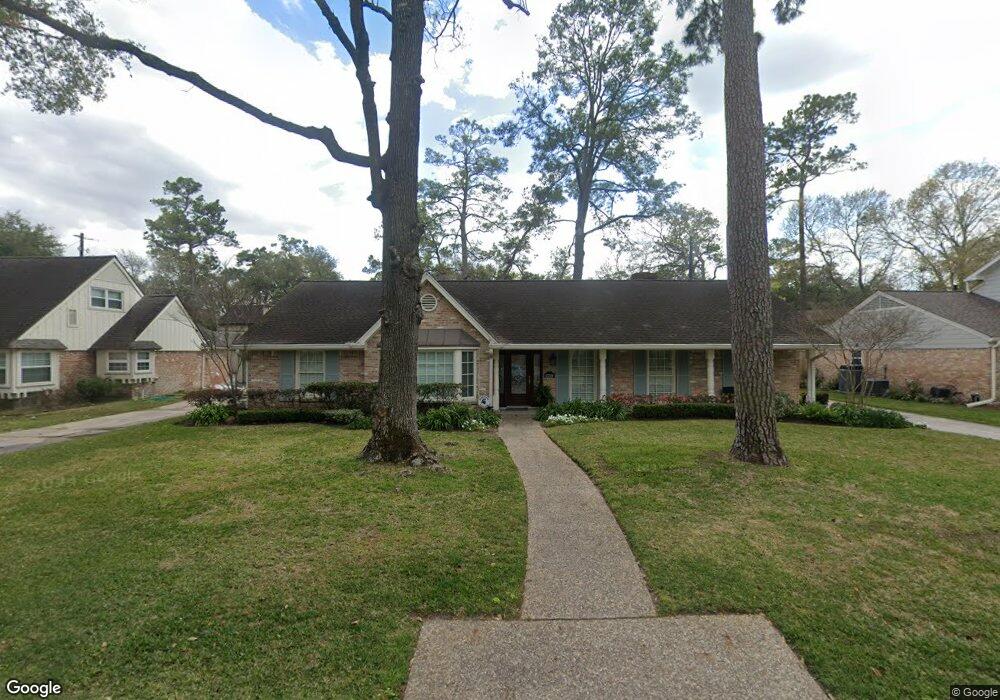
13319 Queensbury Ln Houston, TX 77079
Memorial NeighborhoodEstimated Value: $1,120,000 - $1,180,000
4
Beds
3
Baths
2,405
Sq Ft
$476/Sq Ft
Est. Value
About This Home
This home is located at 13319 Queensbury Ln, Houston, TX 77079 and is currently estimated at $1,143,633, approximately $475 per square foot. 13319 Queensbury Ln is a home located in Harris County with nearby schools including Wilchester Elementary School, Memorial Middle, and Stratford High School.
Ownership History
Date
Name
Owned For
Owner Type
Purchase Details
Closed on
Apr 21, 2011
Sold by
Virk Gurbachan Singh and Virk Rosemary Smith
Bought by
Byrd Richard Arvin
Current Estimated Value
Home Financials for this Owner
Home Financials are based on the most recent Mortgage that was taken out on this home.
Original Mortgage
$358,000
Outstanding Balance
$247,219
Interest Rate
4.82%
Mortgage Type
New Conventional
Estimated Equity
$896,414
Purchase Details
Closed on
Jan 3, 2008
Sold by
Virk Gurbachan Singh and Virk Rosemary Smith
Bought by
Virk Gurbachan Singh and Virk Rosemary Smith
Purchase Details
Closed on
May 13, 2002
Sold by
Virk Gurbachan Singh and Virk Rosemary Smith
Bought by
Virk Gurbachan Singh and Virk Rosemary Smith
Purchase Details
Closed on
Jan 29, 1994
Sold by
Virk Gurbachan Singh and Virk Rosemary Smith
Bought by
Virk Gurbachan Singh and Virk Rosemary Smith
Create a Home Valuation Report for This Property
The Home Valuation Report is an in-depth analysis detailing your home's value as well as a comparison with similar homes in the area
Home Values in the Area
Average Home Value in this Area
Purchase History
| Date | Buyer | Sale Price | Title Company |
|---|---|---|---|
| Byrd Richard Arvin | -- | Tradition Title Company | |
| Virk Gurbachan Singh | -- | None Available | |
| Virk Gurbachan Singh | -- | -- | |
| Virk Gurbachan Singh | -- | -- | |
| Virk Gurbachan Sing | -- | -- |
Source: Public Records
Mortgage History
| Date | Status | Borrower | Loan Amount |
|---|---|---|---|
| Open | Byrd Richard Arvin | $358,000 |
Source: Public Records
Tax History Compared to Growth
Tax History
| Year | Tax Paid | Tax Assessment Tax Assessment Total Assessment is a certain percentage of the fair market value that is determined by local assessors to be the total taxable value of land and additions on the property. | Land | Improvement |
|---|---|---|---|---|
| 2025 | $17,081 | $1,108,535 | $552,150 | $556,385 |
| 2024 | $17,081 | $1,039,584 | $552,150 | $487,434 |
| 2023 | $17,081 | $1,014,511 | $552,150 | $462,361 |
| 2022 | $19,894 | $925,342 | $524,543 | $400,799 |
| 2021 | $18,887 | $773,588 | $506,138 | $267,450 |
| 2020 | $19,463 | $776,770 | $506,138 | $270,632 |
| 2019 | $20,161 | $770,097 | $506,138 | $263,959 |
| 2018 | $7,243 | $740,000 | $506,138 | $233,862 |
| 2017 | $19,359 | $740,000 | $506,138 | $233,862 |
| 2016 | $19,141 | $844,168 | $506,138 | $338,030 |
| 2015 | $9,255 | $844,168 | $506,138 | $338,030 |
| 2014 | $9,255 | $555,284 | $349,695 | $205,589 |
Source: Public Records
Map
Nearby Homes
- 807 Wycliffe Dr
- 13403 Taylorcrest Rd
- 903 Wycliffe Dr
- 13131 Kimberley Ln
- 866 Myrtlea Ln
- 710 Patchester Dr
- 807 Patchester Dr
- 881 Wax Myrtle Ln Unit A
- 839 Wax Myrtle Ln
- 921 Wax Myrtle Ln
- 939 Wax Myrtle Ln
- 903 Wax Myrtle Ln
- 893 Wax Myrtle Ln Unit 3
- 414 E Gaywood Dr
- 13346 Trail Hollow Dr Unit 3346
- 12984 Trail Hollow Dr Unit 2984
- 13282 Trail Hollow Dr Unit 3282
- 12978 Trail Hollow Dr Unit 2978
- 334 Wycliffe Dr
- 13228 Trail Hollow Dr Unit 3228
- 13315 Queensbury Ln
- 13403 Queensbury Ln
- 13402 Pinerock Ln
- 13406 Pinerock Ln
- 13318 Pinerock Ln
- 13311 Queensbury Ln
- 13407 Queensbury Ln
- 13318 Queensbury Ln
- 13402 Queensbury Ln
- 13314 Pinerock Ln
- 13410 Pinerock Ln
- 13314 Queensbury Ln
- 13406 Queensbury Ln
- 13307 Queensbury Ln
- 13411 Queensbury Ln
- 13310 Queensbury Ln
- 13410 Queensbury Ln
- 13414 Pinerock Ln
- 13306 Pinerock Ln
- 13319 Barryknoll Ln