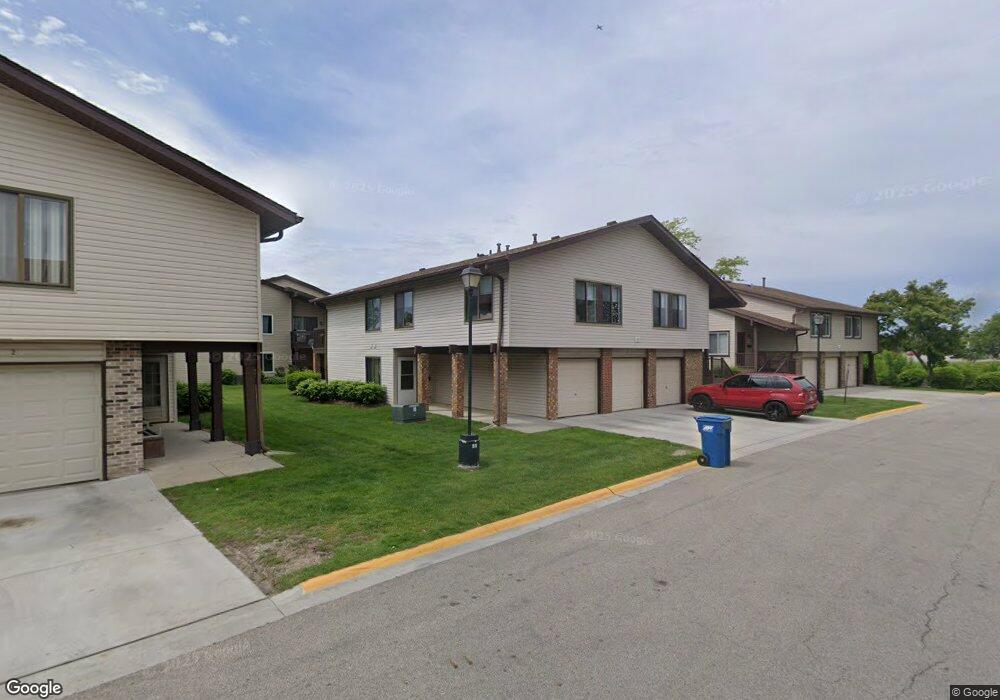
1332 Kingsbury Dr Unit 403 Hanover Park, IL 60133
Estimated Value: $223,000 - $249,000
3
Beds
--
Bath
1,000
Sq Ft
$236/Sq Ft
Est. Value
About This Home
This home is located at 1332 Kingsbury Dr Unit 403, Hanover Park, IL 60133 and is currently estimated at $236,116, approximately $236 per square foot. 1332 Kingsbury Dr Unit 403 is a home located in Cook County with nearby schools including Albert Einstein Elementary School, Jane Addams Junior High School, and Hoffman Estates High School.
Ownership History
Date
Name
Owned For
Owner Type
Purchase Details
Closed on
Jul 30, 2014
Sold by
Visal Rahul
Bought by
Vertex Real Estate Group Llc
Current Estimated Value
Purchase Details
Closed on
Nov 21, 2000
Sold by
Jones Shannon D and Jones Donna M
Bought by
Spindler Frederick B
Home Financials for this Owner
Home Financials are based on the most recent Mortgage that was taken out on this home.
Original Mortgage
$90,250
Interest Rate
7.8%
Purchase Details
Closed on
Feb 12, 1999
Sold by
Jones Donna M and Krieter Jerrold J
Bought by
Jones Shannon D and Jones Donna M
Purchase Details
Closed on
Apr 25, 1997
Sold by
Qazi Abdul R and Azam Mary Q
Bought by
Krieter Jerrold J and Krieter Donna M
Home Financials for this Owner
Home Financials are based on the most recent Mortgage that was taken out on this home.
Original Mortgage
$80,450
Interest Rate
8.05%
Mortgage Type
FHA
Create a Home Valuation Report for This Property
The Home Valuation Report is an in-depth analysis detailing your home's value as well as a comparison with similar homes in the area
Home Values in the Area
Average Home Value in this Area
Purchase History
| Date | Buyer | Sale Price | Title Company |
|---|---|---|---|
| Vertex Real Estate Group Llc | -- | Fidelity National Title | |
| Visal Rahul | $73,500 | None Available | |
| Spindler Frederick B | $101,000 | -- | |
| Jones Shannon D | -- | -- | |
| Krieter Jerrold J | $84,500 | -- |
Source: Public Records
Mortgage History
| Date | Status | Borrower | Loan Amount |
|---|---|---|---|
| Previous Owner | Spindler Frederick B | $90,250 | |
| Previous Owner | Krieter Jerrold J | $80,450 |
Source: Public Records
Tax History Compared to Growth
Tax History
| Year | Tax Paid | Tax Assessment Tax Assessment Total Assessment is a certain percentage of the fair market value that is determined by local assessors to be the total taxable value of land and additions on the property. | Land | Improvement |
|---|---|---|---|---|
| 2024 | $4,445 | $14,082 | $583 | $13,499 |
| 2023 | $4,300 | $14,082 | $583 | $13,499 |
| 2022 | $4,300 | $14,082 | $583 | $13,499 |
| 2021 | $3,532 | $9,989 | $381 | $9,608 |
| 2020 | $3,489 | $9,989 | $381 | $9,608 |
| 2019 | $3,510 | $11,184 | $381 | $10,803 |
| 2018 | $2,879 | $8,122 | $336 | $7,786 |
| 2017 | $2,832 | $8,122 | $336 | $7,786 |
| 2016 | $2,664 | $8,122 | $336 | $7,786 |
| 2015 | $2,117 | $5,965 | $291 | $5,674 |
| 2014 | $1,182 | $5,965 | $291 | $5,674 |
| 2013 | -- | $5,965 | $291 | $5,674 |
Source: Public Records
Map
Nearby Homes
- 7526 Bristol Ln Unit 502
- 7523 Bristol Ln Unit A
- 1323 Kingsbury Dr Unit 2
- 1316 Kingsbury Dr Unit 1
- 1283 Bristol Ln
- 1307 Kingsbury Dr Unit A
- 7837 Huntington Cir S
- 7873 Asbury Cir S
- 7843 Kensington Ln
- 1648 Linden Ave
- 7211 Jonquil Terrace
- 1105 Stratford Ln
- 1712 Poplar Ave
- 8138 N Carrolton Ct
- 7418 Nantucket Cove
- 7138 Edgebrook Ln
- 802 Lexington Cir
- 763 Verandah Dr
- 1591 Hillcrest Ave
- 7170 East Ave
- 1332 Kingsbury Dr Unit 3
- 1332 Kingsbury Dr Unit 402
- 1332 Kingsbury Dr Unit 401
- 1332 Kingsbury Dr Unit 1
- 1333 Kingsbury Dr Unit 2
- 1333 Kingsbury Dr Unit 412
- 1333 Kingsbury Dr Unit 413
- 1333 Kingsbury Dr Unit 411
- 1331 Kingsbury Dr Unit 392
- 1331 Kingsbury Dr Unit 391
- 1331 Kingsbury Dr Unit 393
- 1331 Kingsbury Dr Unit 1
- 7529 Bristol Ln Unit 462
- 7529 Bristol Ln Unit 461
- 7529 Bristol Ln Unit 463
- 7529 Bristol Ln Unit 3
- 1329 Kingsbury Dr Unit 376
- 1329 Kingsbury Dr Unit 374
- 1329 Kingsbury Dr Unit 375
- 1329 Kingsbury Dr Unit 4