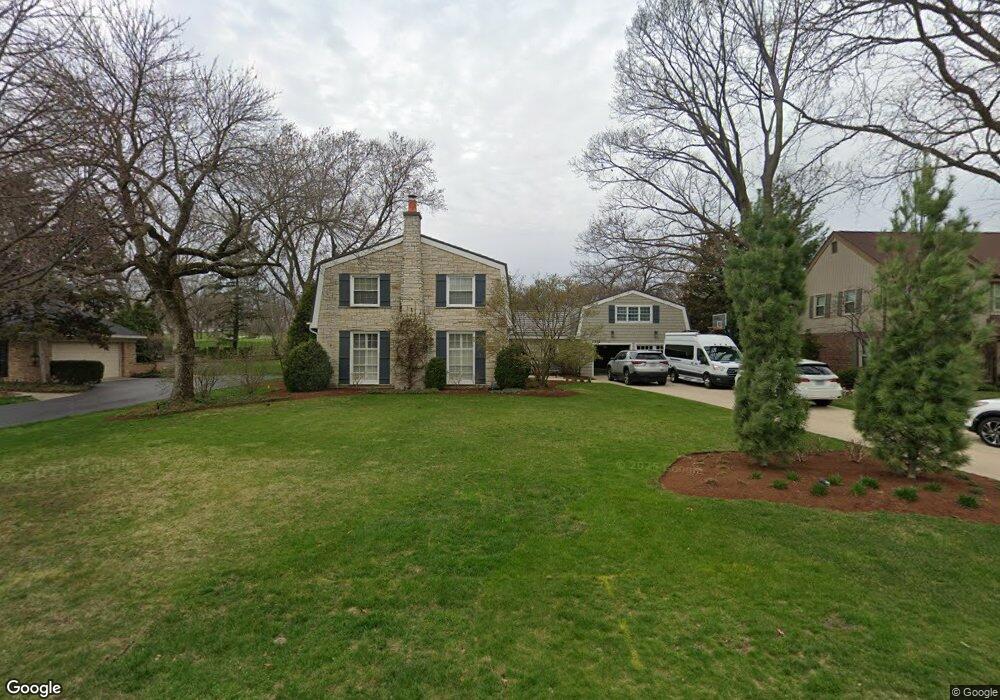
1332 Laurie Ln Burr Ridge, IL 60527
South Hinsdale NeighborhoodEstimated Value: $988,000 - $1,087,000
5
Beds
4
Baths
3,608
Sq Ft
$288/Sq Ft
Est. Value
About This Home
This home is located at 1332 Laurie Ln, Burr Ridge, IL 60527 and is currently estimated at $1,038,279, approximately $287 per square foot. 1332 Laurie Ln is a home located in Cook County with nearby schools including Elm Elementary School, Hinsdale Middle School, and Hinsdale Central High School.
Ownership History
Date
Name
Owned For
Owner Type
Purchase Details
Closed on
Sep 8, 2002
Sold by
Stefani Roger C and Stefani Margaret M
Bought by
Harrell John R and Harrell Mary V
Current Estimated Value
Home Financials for this Owner
Home Financials are based on the most recent Mortgage that was taken out on this home.
Original Mortgage
$417,750
Interest Rate
6.54%
Mortgage Type
Balloon
Purchase Details
Closed on
May 8, 1995
Sold by
Stefani Roger C and Stefani Margaret M
Bought by
Stefani Roger C and Stefani Margaret M
Purchase Details
Closed on
May 24, 1994
Sold by
Canadian Imperial Bank Of Commerce
Bought by
Stefani Roger C and Stefani Margaret M
Home Financials for this Owner
Home Financials are based on the most recent Mortgage that was taken out on this home.
Original Mortgage
$250,000
Interest Rate
8.58%
Purchase Details
Closed on
Nov 11, 1993
Sold by
Watts Richard W and Watts Patricia A
Bought by
Canadian Imperial Bank Of Commerce
Create a Home Valuation Report for This Property
The Home Valuation Report is an in-depth analysis detailing your home's value as well as a comparison with similar homes in the area
Home Values in the Area
Average Home Value in this Area
Purchase History
| Date | Buyer | Sale Price | Title Company |
|---|---|---|---|
| Harrell John R | $558,000 | -- | |
| Stefani Roger C | -- | -- | |
| Stefani Roger C | $325,000 | -- | |
| Canadian Imperial Bank Of Commerce | -- | -- |
Source: Public Records
Mortgage History
| Date | Status | Borrower | Loan Amount |
|---|---|---|---|
| Closed | Harrell John R | $417,750 | |
| Previous Owner | Stefani Roger C | $250,000 |
Source: Public Records
Tax History Compared to Growth
Tax History
| Year | Tax Paid | Tax Assessment Tax Assessment Total Assessment is a certain percentage of the fair market value that is determined by local assessors to be the total taxable value of land and additions on the property. | Land | Improvement |
|---|---|---|---|---|
| 2024 | $16,165 | $77,000 | $12,400 | $64,600 |
| 2023 | $16,561 | $77,000 | $12,400 | $64,600 |
| 2022 | $16,561 | $69,841 | $10,800 | $59,041 |
| 2021 | $15,835 | $69,841 | $10,800 | $59,041 |
| 2020 | $15,300 | $69,841 | $10,800 | $59,041 |
| 2019 | $15,872 | $74,312 | $10,000 | $64,312 |
| 2018 | $15,092 | $74,312 | $10,000 | $64,312 |
| 2017 | $14,674 | $74,312 | $10,000 | $64,312 |
| 2016 | $12,990 | $59,589 | $8,800 | $50,789 |
| 2015 | $12,698 | $59,589 | $8,800 | $50,789 |
| 2014 | $12,708 | $59,589 | $8,800 | $50,789 |
| 2013 | $11,903 | $56,561 | $8,800 | $47,761 |
Source: Public Records
Map
Nearby Homes
- 6116 S County Line Rd
- The Bostonian Plan at Timber Trails of Western Springs
- The Astoria Plan at Timber Trails of Western Springs
- The Fenwick Plan at Timber Trails of Western Springs
- The Brunswick Plan at Timber Trails of Western Springs
- 15W120 60th St
- 5531 Barton Ln
- 6008 Burr Oak (Lot 129) Dr
- 6191 S County Line Rd
- 15W170 60th St
- 567 Hannah Ln
- 565 Hannah Ln Unit 712
- 5903 Timber Trails (Lot 54) Blvd
- 1604 Burr Ridge Club
- 5913 Timber Trails (Lot 59) Blvd
- 522 Pamela Cir
- 6403 S County Line Rd
- 930 Harding Rd
- 15W080 60th St
- 320 Claymoor Unit 2D
- 1340 Laurie Ln
- 1324 Laurie Ln
- 1316 Laurie Ln
- 1348 Laurie Ln
- 1331 Laurie Ln
- 700 Tomlin Dr
- 1339 Laurie Ln
- 1308 Laurie Ln
- 701 Gregford Rd
- 708 Tomlin Dr
- 1309 Laurie Ln
- 709 Gregford Rd
- 1300 Laurie Ln
- 638 Gregford Rd
- 646 Gregford Rd
- 716 Tomlin Dr
- 1301 Laurie Ln
- 717 Gregford Rd
- 708 Gregford Rd
- 1248 Laurie Ln