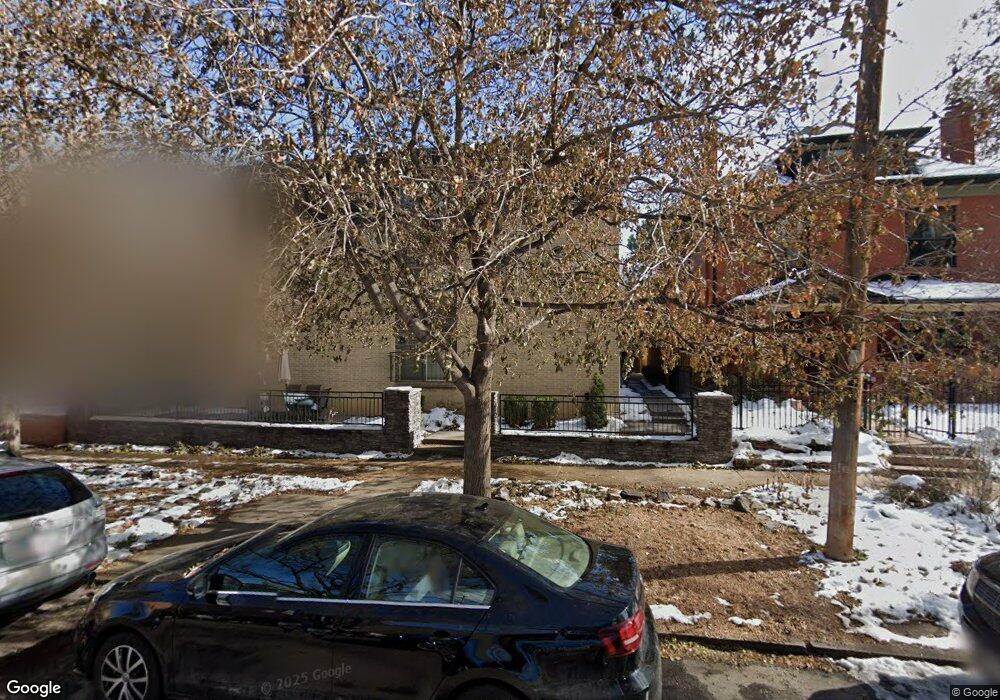
1332 N Williams St Unit 202 Denver, CO 80218
Cheesman Park NeighborhoodEstimated Value: $238,034 - $366,000
1
Bed
1
Bath
644
Sq Ft
$464/Sq Ft
Est. Value
About This Home
This home is located at 1332 N Williams St Unit 202, Denver, CO 80218 and is currently estimated at $299,009, approximately $464 per square foot. 1332 N Williams St Unit 202 is a home located in Denver County with nearby schools including Dora Moore ECE-8 School, Morey Middle School, and East High School.
Ownership History
Date
Name
Owned For
Owner Type
Purchase Details
Closed on
Apr 5, 2019
Sold by
Rigatti Vincent G and Rigatti Marjorie R
Bought by
Speer Kyla
Current Estimated Value
Home Financials for this Owner
Home Financials are based on the most recent Mortgage that was taken out on this home.
Original Mortgage
$252,103
Outstanding Balance
$221,643
Interest Rate
4.3%
Mortgage Type
New Conventional
Estimated Equity
$77,366
Purchase Details
Closed on
Jul 29, 2016
Sold by
Torres Humberto
Bought by
Rigatti Vincent G and Rigatti Marjorie R
Purchase Details
Closed on
Jan 29, 2010
Sold by
Williams Investors Llc
Bought by
Torres Humberto
Home Financials for this Owner
Home Financials are based on the most recent Mortgage that was taken out on this home.
Original Mortgage
$145,809
Interest Rate
5.5%
Mortgage Type
FHA
Create a Home Valuation Report for This Property
The Home Valuation Report is an in-depth analysis detailing your home's value as well as a comparison with similar homes in the area
Home Values in the Area
Average Home Value in this Area
Purchase History
| Date | Buyer | Sale Price | Title Company |
|---|---|---|---|
| Speer Kyla | $259,900 | Land Title Guarantee Co | |
| Rigatti Vincent G | $232,000 | Land Title Guarantee | |
| Torres Humberto | $148,500 | Chicago Title Co |
Source: Public Records
Mortgage History
| Date | Status | Borrower | Loan Amount |
|---|---|---|---|
| Open | Speer Kyla | $252,103 | |
| Previous Owner | Torres Humberto | $145,809 |
Source: Public Records
Tax History Compared to Growth
Tax History
| Year | Tax Paid | Tax Assessment Tax Assessment Total Assessment is a certain percentage of the fair market value that is determined by local assessors to be the total taxable value of land and additions on the property. | Land | Improvement |
|---|---|---|---|---|
| 2024 | $1,158 | $14,620 | $2,370 | $12,250 |
| 2023 | $1,133 | $14,620 | $2,370 | $12,250 |
| 2022 | $1,373 | $17,270 | $2,450 | $14,820 |
| 2021 | $1,373 | $17,760 | $2,520 | $15,240 |
| 2020 | $1,362 | $18,360 | $2,220 | $16,140 |
| 2019 | $1,324 | $18,360 | $2,220 | $16,140 |
| 2018 | $1,184 | $15,310 | $2,100 | $13,210 |
| 2017 | $1,181 | $15,310 | $2,100 | $13,210 |
| 2016 | $1,187 | $14,550 | $1,815 | $12,735 |
| 2015 | $1,137 | $14,550 | $1,815 | $12,735 |
| 2014 | $1,017 | $12,240 | $1,329 | $10,911 |
Source: Public Records
Map
Nearby Homes
- 1313 N Williams St Unit 1602
- 1201 N Williams St Unit 2A
- 1201 N Williams St Unit 17A
- 1201 N Williams St Unit 2B
- 1315 N High St
- 1433 N Williams St Unit 1206
- 1345 Franklin St
- 1436 N Gilpin St Unit 4
- 1436 N Gilpin St Unit 9
- 1373 N Franklin St Unit 3
- 1265 Race St Unit 202
- 1265 Race St Unit 208
- 1320 N Humboldt St
- 1451 Gilpin St
- 1438 Franklin St Unit 100
- 1250 N Humboldt St Unit 805
- 1450 N High St Unit 3
- 1337 N Humboldt St
- 1200 N Humboldt St Unit 303
- 1200 N Humboldt St Unit 305
- 1332 N Williams St Unit 304
- 1332 N Williams St Unit 102
- 1332 N Williams St Unit 303
- 1332 N Williams St Unit 101
- 1332 N Williams St Unit 201
- 1332 N Williams St Unit 301
- 1332 N Williams St Unit 203
- 1332 N Williams St Unit 302
- 1332 Williams St
- 1332 Williams St
- 1332 Williams St
- 1332 Williams St
- 1332 Williams St
- 1332 Williams St
- 1332 Williams St
- 1332 Williams St
- 1332 Williams St
- 1332 Williams St
- 1332 Williams St
- 1332 Williams St