Estimated Value: $145,000 - $161,000
3
Beds
1
Bath
1,456
Sq Ft
$106/Sq Ft
Est. Value
About This Home
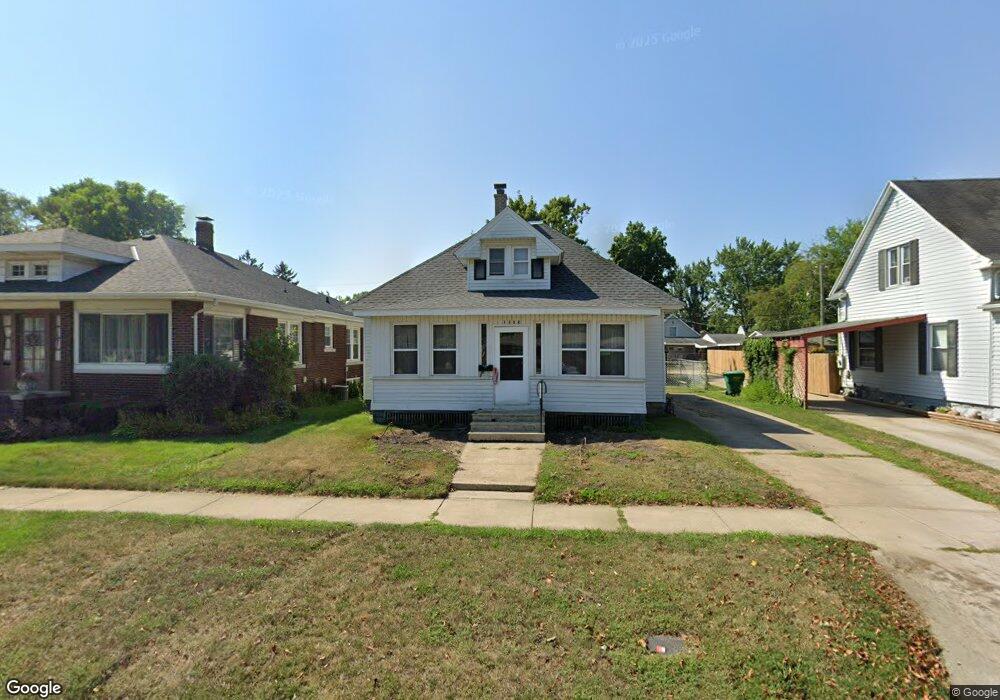
This home is located at 1332 Oak St, Niles, MI 49120 and is currently estimated at $154,508, approximately $106 per square foot. 1332 Oak St is a home located in Berrien County with nearby schools including James Ellis School, Howard-Ellis Elementary School, and Oak Manor Sixth Grade Center.
Ownership History
Date
Name
Owned For
Owner Type
Purchase Details
Closed on
Nov 18, 2024
Sold by
Huff Richard A
Bought by
Huff Sydni R
Current Estimated Value
Home Financials for this Owner
Home Financials are based on the most recent Mortgage that was taken out on this home.
Original Mortgage
$64,000
Outstanding Balance
$54,643
Interest Rate
6.12%
Mortgage Type
Balloon
Estimated Equity
$99,865
Purchase Details
Closed on
Oct 31, 2024
Sold by
Huff Jenny Marie
Bought by
Huff Richard A
Home Financials for this Owner
Home Financials are based on the most recent Mortgage that was taken out on this home.
Original Mortgage
$64,000
Outstanding Balance
$54,643
Interest Rate
6.12%
Mortgage Type
Balloon
Estimated Equity
$99,865
Purchase Details
Closed on
Sep 3, 2024
Sold by
Johnson Jenny Marie
Bought by
Huff Jenny Marie
Create a Home Valuation Report for This Property
The Home Valuation Report is an in-depth analysis detailing your home's value as well as a comparison with similar homes in the area
Home Values in the Area
Average Home Value in this Area
Purchase History
We collect this data history from publicly available records. To have your information removed, we recommend requesting removal directly through your county’s website.
| Date | Buyer | Sale Price | Title Company |
|---|---|---|---|
| Huff Sydni R | $80,000 | None Listed On Document | |
| Huff Sydni R | $80,000 | None Listed On Document | |
| Huff Richard A | -- | None Listed On Document | |
| Huff Jenny Marie | $80,000 | None Listed On Document |
Source: Public Records
Mortgage History
We collect this data history from publicly available records. To have your information removed, we recommend requesting removal directly through your county’s website.
| Date | Status | Borrower | Loan Amount |
|---|---|---|---|
| Open | Huff Sydni R | $64,000 | |
| Closed | Huff Sydni R | $64,000 |
Source: Public Records
Tax History
| Year | Tax Paid | Tax Assessment Tax Assessment Total Assessment is a certain percentage of the fair market value that is determined by local assessors to be the total taxable value of land and additions on the property. | Land | Improvement |
|---|---|---|---|---|
| 2025 | $1,224 | $79,000 | $0 | $0 |
| 2024 | $955 | $73,200 | $0 | $0 |
| 2023 | $916 | $63,900 | $0 | $0 |
| 2022 | $872 | $59,400 | $0 | $0 |
| 2021 | $1,074 | $55,400 | $3,100 | $52,300 |
| 2020 | $1,062 | $43,000 | $0 | $0 |
| 2019 | $1,049 | $46,000 | $8,500 | $37,500 |
| 2018 | $1,015 | $46,000 | $0 | $0 |
| 2017 | $998 | $36,800 | $0 | $0 |
| 2016 | $977 | $34,600 | $0 | $0 |
| 2015 | $974 | $31,300 | $0 | $0 |
| 2014 | $757 | $31,100 | $0 | $0 |
Source: Public Records
Map
Nearby Homes
- 1329 Oak St
- 1321 Oak St
- 1332 Broadway St
- 1320 Broadway St
- 1339 Oak St
- 1325 Oak St
- 1333 Oak St
- 1327 Oak St
- 1325 Oak St
- 1333 Oak St
- 1333 Oak St Unit A - 2
- 1325 Oak St Unit B2
- 1333 Oak St Unit A1
- 1336 Broadway St
- 1315 Oak St
- 1314 Broadway St
- 1328 Broadway St
- 1328 Broadway St
- 1328 Broadway St Unit D-4
- 1328 Broadway St Unit D3
Your Personal Tour Guide
Ask me questions while you tour the home.