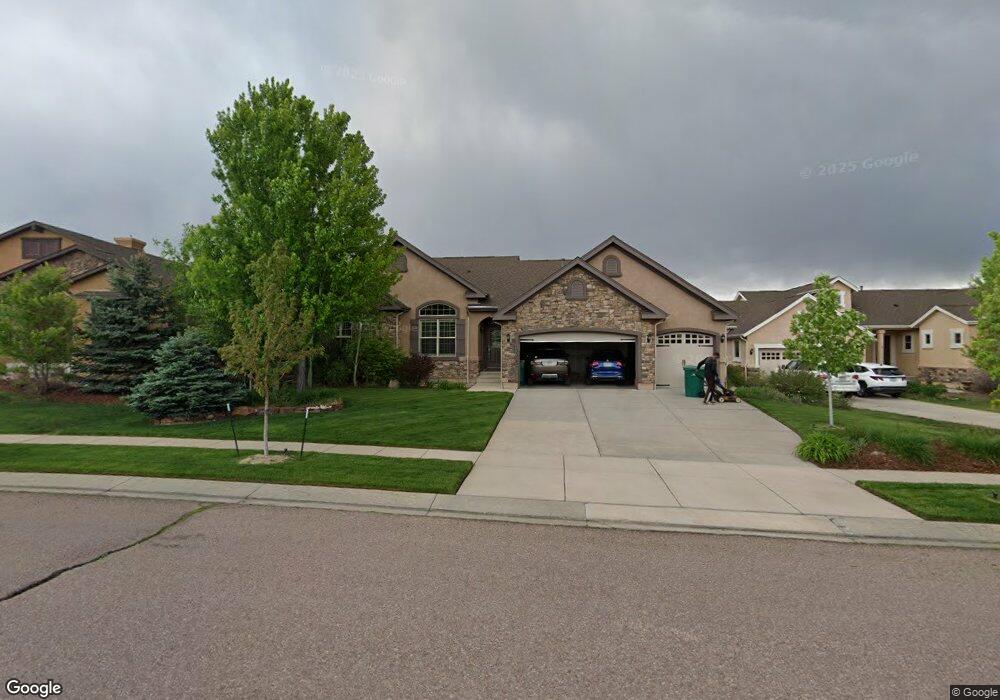
13325 Crane Canyon Loop Colorado Springs, CO 80921
Flying Horse Ranch NeighborhoodEstimated Value: $848,967 - $1,000,000
4
Beds
3
Baths
2,151
Sq Ft
$437/Sq Ft
Est. Value
About This Home
This home is located at 13325 Crane Canyon Loop, Colorado Springs, CO 80921 and is currently estimated at $939,992, approximately $437 per square foot. 13325 Crane Canyon Loop is a home with nearby schools including Discovery Canyon Campus Elementary School, Discovery Canyon Campus Middle School, and Discovery Canyon Campus High School.
Ownership History
Date
Name
Owned For
Owner Type
Purchase Details
Closed on
Jun 18, 2015
Sold by
The Michael Scott Garrison & Cindy Marie
Bought by
Gilbert Sampson
Current Estimated Value
Home Financials for this Owner
Home Financials are based on the most recent Mortgage that was taken out on this home.
Original Mortgage
$498,000
Outstanding Balance
$387,904
Interest Rate
3.91%
Mortgage Type
VA
Estimated Equity
$552,088
Purchase Details
Closed on
Oct 15, 2010
Sold by
Elite Properties Of America Inc
Bought by
The Michael Scott Garrison & Cindy Marie
Purchase Details
Closed on
Jul 8, 2010
Sold by
Mckinney Classic 1 Llc
Bought by
Elite Properties Of America Inc
Home Financials for this Owner
Home Financials are based on the most recent Mortgage that was taken out on this home.
Original Mortgage
$331,645
Interest Rate
4.78%
Mortgage Type
Credit Line Revolving
Create a Home Valuation Report for This Property
The Home Valuation Report is an in-depth analysis detailing your home's value as well as a comparison with similar homes in the area
Home Values in the Area
Average Home Value in this Area
Purchase History
| Date | Buyer | Sale Price | Title Company |
|---|---|---|---|
| Gilbert Sampson | $525,000 | North American Title | |
| The Michael Scott Garrison & Cindy Marie | $414,514 | Cb Title | |
| Elite Properties Of America Inc | $95,000 | Cb Title |
Source: Public Records
Mortgage History
| Date | Status | Borrower | Loan Amount |
|---|---|---|---|
| Open | Gilbert Sampson | $498,000 | |
| Previous Owner | Elite Properties Of America Inc | $331,645 |
Source: Public Records
Tax History Compared to Growth
Tax History
| Year | Tax Paid | Tax Assessment Tax Assessment Total Assessment is a certain percentage of the fair market value that is determined by local assessors to be the total taxable value of land and additions on the property. | Land | Improvement |
|---|---|---|---|---|
| 2025 | $5,130 | $56,390 | -- | -- |
| 2024 | $5,050 | $52,260 | $9,580 | $42,680 |
| 2022 | $4,364 | $40,240 | $9,040 | $31,200 |
| 2021 | $4,690 | $41,400 | $9,300 | $32,100 |
| 2020 | $4,743 | $39,920 | $9,300 | $30,620 |
| 2019 | $4,710 | $39,920 | $9,300 | $30,620 |
| 2018 | $4,213 | $35,380 | $7,490 | $27,890 |
| 2017 | $4,453 | $35,380 | $7,490 | $27,890 |
| 2016 | $4,196 | $35,170 | $7,240 | $27,930 |
| 2015 | $4,191 | $35,170 | $7,240 | $27,930 |
| 2014 | $3,847 | $32,270 | $7,240 | $25,030 |
Source: Public Records
Map
Nearby Homes
- 1468 Yellow Tail Dr
- 1489 Yellow Tail Dr
- 1449 Yellow Tail Dr
- 1130 Spectrum Loop
- 1117 Spectrum Loop
- 13435 Cedarville Way
- 13445 Cedarville Way
- 1053 Crystal Basin Dr
- 1131 Old North Gate Rd
- 1609 Yellow Tail Dr
- 13364 Positano Point
- 1104 Equinox Dr
- 960 Fire Rock Place
- 13457 Pride Mountain Dr
- 13497 Pride Mountain Dr
- 13518 Pride Mountain Dr
- 1385 Diamond Rim Dr
- 13557 Pride Mountain Dr
- 1069 Glengary Place
- 806 Spectrum Loop
- 13337 Crane Canyon Loop
- 13349 Crane Canyon Loop
- 13301 Crane Canyon Loop
- 13362 Crane Canyon Loop
- 13278 Crane Canyon Loop
- 13289 Crane Canyon Loop
- 13374 Crane Canyon Loop
- 13277 Crane Canyon Loop
- 13266 Crane Canyon Loop
- 13386 Crane Canyon Loop
- 13254 Crane Canyon Loop
- 13265 Crane Canyon Loop
- 13253 Crane Canyon Loop
- 13398 Crane Canyon Loop
- 13242 Crane Canyon Loop
- 13241 Crane Canyon Loop
- 13410 Crane Canyon Loop
- 13230 Crane Canyon Loop
- 1185 Crystal Basin Dr
- 1498 Yellow Tail Dr