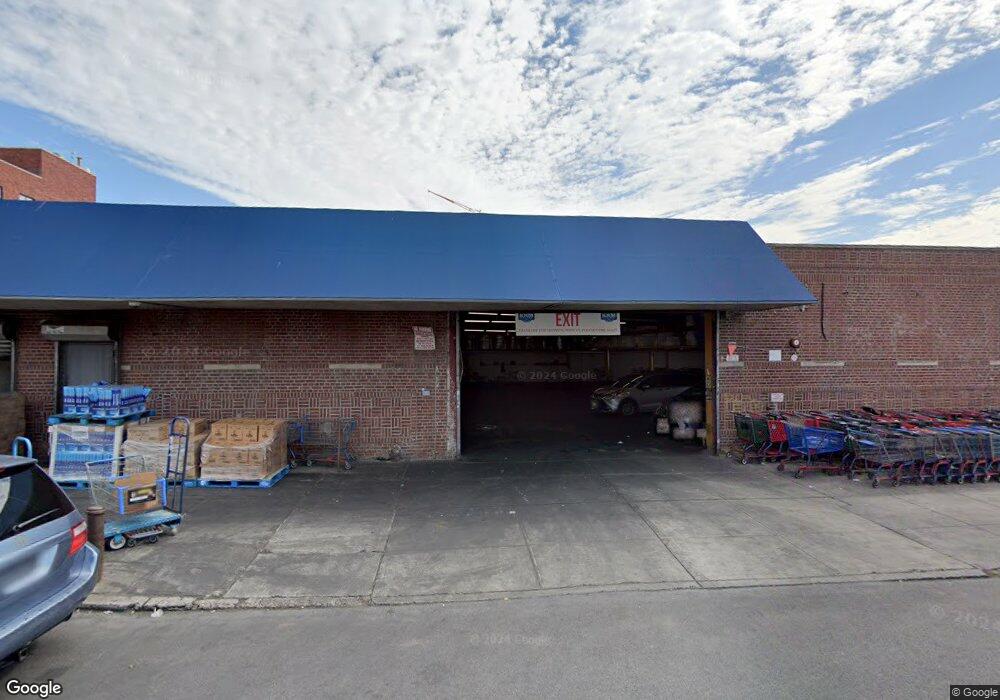
1333 39th St Brooklyn, NY 11218
Borough Park NeighborhoodEstimated Value: $6,921,333
Studio
--
Bath
9,500
Sq Ft
$729/Sq Ft
Est. Value
About This Home
This home is located at 1333 39th St, Brooklyn, NY 11218 and is currently estimated at $6,921,333, approximately $728 per square foot. 1333 39th St is a home located in Kings County with nearby schools including P.S. 230 Doris L Cohen, I.S. 223 The Montauk, and Franklin Delano Roosevelt High School.
Ownership History
Date
Name
Owned For
Owner Type
Purchase Details
Closed on
Feb 11, 2025
Sold by
1333 39Th Street Llc
Bought by
1351 39 St Llc
Current Estimated Value
Purchase Details
Closed on
Feb 2, 2006
Sold by
The Ciro J Esposito Family Ltd Partner
Bought by
1333 39Th Street Llc
Purchase Details
Closed on
Dec 29, 2000
Sold by
J Esposito & Sons Of Bro
Bought by
Ciro J Esposito Family L
Create a Home Valuation Report for This Property
The Home Valuation Report is an in-depth analysis detailing your home's value as well as a comparison with similar homes in the area
Home Values in the Area
Average Home Value in this Area
Purchase History
| Date | Buyer | Sale Price | Title Company |
|---|---|---|---|
| 1351 39 St Llc | -- | -- | |
| 1351 39 St Llc | -- | -- | |
| 1333 39Th Street Llc | $3,500,000 | -- | |
| 1333 39Th Street Llc | $3,500,000 | -- | |
| Ciro J Esposito Family L | -- | -- | |
| Ciro J Esposito Family L | -- | -- |
Source: Public Records
Tax History
| Year | Tax Paid | Tax Assessment Tax Assessment Total Assessment is a certain percentage of the fair market value that is determined by local assessors to be the total taxable value of land and additions on the property. | Land | Improvement |
|---|---|---|---|---|
| 2025 | $44,661 | $1,279,350 | $273,600 | $1,005,750 |
| 2024 | $44,661 | $1,119,150 | $273,600 | $845,550 |
| 2023 | $42,082 | $953,550 | $273,600 | $679,950 |
| 2022 | $33,346 | $819,000 | $273,600 | $545,400 |
| 2021 | $29,259 | $774,000 | $273,600 | $500,400 |
| 2020 | $25,953 | $913,500 | $273,600 | $639,900 |
| 2019 | $50,294 | $913,500 | $273,600 | $639,900 |
| 2018 | $50,294 | $865,350 | $273,600 | $591,750 |
| 2017 | $50,293 | $764,100 | $273,600 | $490,500 |
| 2016 | $50,581 | $751,500 | $273,600 | $477,900 |
| 2015 | $21,042 | $595,800 | $273,600 | $322,200 |
| 2014 | $21,042 | $622,350 | $273,600 | $348,750 |
Source: Public Records
Map
Nearby Homes
Your Personal Tour Guide
Ask me questions while you tour the home.