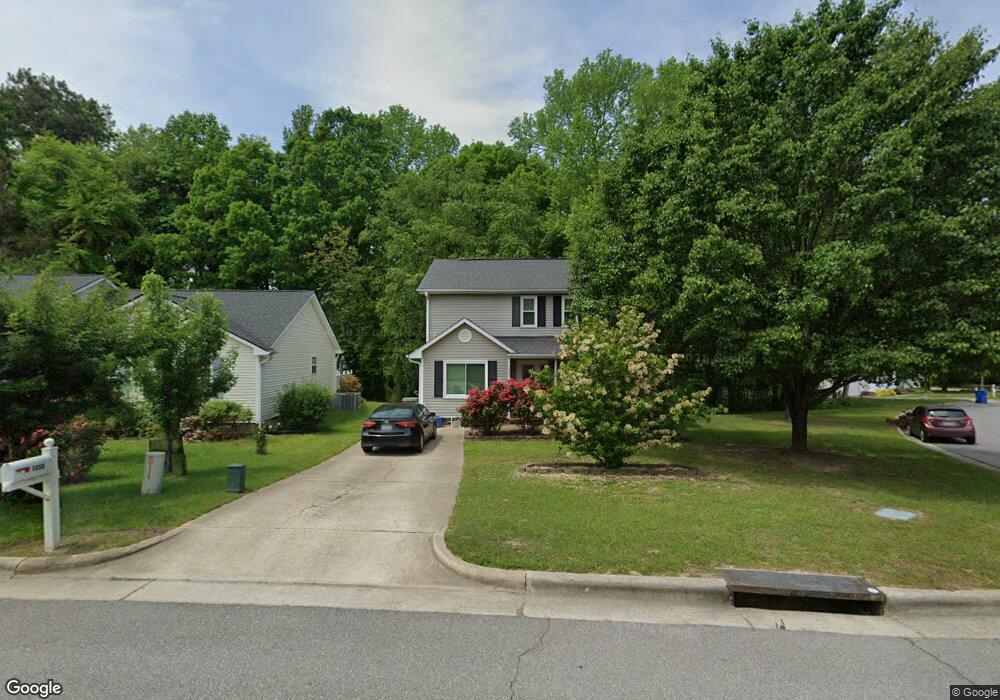
1333 Balfour Downs Cir Fuquay Varina, NC 27526
Estimated Value: $314,000 - $350,132
3
Beds
3
Baths
1,536
Sq Ft
$218/Sq Ft
Est. Value
About This Home
This home is located at 1333 Balfour Downs Cir, Fuquay Varina, NC 27526 and is currently estimated at $335,283, approximately $218 per square foot. 1333 Balfour Downs Cir is a home located in Wake County with nearby schools including Holly Grove Middle School, Fuquay-Varina High, and Southern Wake Academy.
Ownership History
Date
Name
Owned For
Owner Type
Purchase Details
Closed on
Jun 19, 2012
Sold by
Byrd John L and Byrd Sherin
Bought by
Bornes Sandra
Current Estimated Value
Home Financials for this Owner
Home Financials are based on the most recent Mortgage that was taken out on this home.
Original Mortgage
$133,571
Outstanding Balance
$90,227
Interest Rate
3.84%
Mortgage Type
New Conventional
Estimated Equity
$245,056
Purchase Details
Closed on
Mar 31, 2009
Sold by
Berkebile Christopher A and Berkebile Deanna Jill
Bought by
Byrd John L and Byrd Sherin
Home Financials for this Owner
Home Financials are based on the most recent Mortgage that was taken out on this home.
Original Mortgage
$127,551
Interest Rate
5.1%
Mortgage Type
Purchase Money Mortgage
Create a Home Valuation Report for This Property
The Home Valuation Report is an in-depth analysis detailing your home's value as well as a comparison with similar homes in the area
Home Values in the Area
Average Home Value in this Area
Purchase History
| Date | Buyer | Sale Price | Title Company |
|---|---|---|---|
| Bornes Sandra | $131,000 | None Available | |
| Byrd John L | $125,000 | None Available |
Source: Public Records
Mortgage History
| Date | Status | Borrower | Loan Amount |
|---|---|---|---|
| Open | Bornes Sandra | $133,571 | |
| Previous Owner | Byrd John L | $127,551 |
Source: Public Records
Tax History Compared to Growth
Tax History
| Year | Tax Paid | Tax Assessment Tax Assessment Total Assessment is a certain percentage of the fair market value that is determined by local assessors to be the total taxable value of land and additions on the property. | Land | Improvement |
|---|---|---|---|---|
| 2025 | $2,810 | $318,846 | $95,000 | $223,846 |
| 2024 | $2,799 | $318,846 | $95,000 | $223,846 |
| 2023 | $2,237 | $199,413 | $43,000 | $156,413 |
| 2022 | $2,103 | $199,413 | $43,000 | $156,413 |
| 2021 | $2,004 | $199,413 | $43,000 | $156,413 |
| 2020 | $2,004 | $199,413 | $43,000 | $156,413 |
| 2019 | $1,640 | $140,446 | $37,000 | $103,446 |
| 2018 | $1,547 | $140,446 | $37,000 | $103,446 |
| 2017 | $1,491 | $140,446 | $37,000 | $103,446 |
| 2016 | $1,471 | $140,446 | $37,000 | $103,446 |
| 2015 | $1,364 | $134,423 | $35,000 | $99,423 |
| 2014 | $1,314 | $134,423 | $35,000 | $99,423 |
Source: Public Records
Map
Nearby Homes
- 1728 Balfour Downs Cir
- 1919 Stroll Cir
- 1726 Stroll Cir
- 1707 Stroll Cir
- 1020 Garrow Dr
- 38 Clove Hitch Ln
- 502 Burton St
- 1017 Quindell Dr
- 1210 Briar Gate Dr
- 1894 Landstrom Ln
- 316 Edgecroft Way
- 328 Edgecroft Way
- 1308 Mcfarlan Ct
- 155 Chapel Dr
- 147 Chapel Dr
- 133 Chapel Dr
- 123 Chapel Dr
- 176 Breezemont Dr
- 1312 Sippihaw Dr
- 301 Santee Cir
- 1329 Balfour Downs Cir
- 1401 Balfour Downs Cir
- 1325 Balfour Downs Cir
- 809 Swan Hill Ct
- 1320 Balfour Downs Cir
- 1400 Balfour Downs Cir
- 1405 Balfour Downs Cir
- 1321 Balfour Downs Cir
- 1318 Balfour Downs Cir
- 804 Swan Hill Ct
- 813 Swan Hill Ct
- 1404 Balfour Downs Cir
- 1317 Balfour Downs Cir
- 1409 Balfour Downs Cir
- 702 Swan Hill Ct
- 1316 Balfour Downs Cir
- 703 Swan Hill Ct
- 808 Swan Hill Ct
- 1206 Poplar Ridge Rd
- 817 Swan Hill Ct