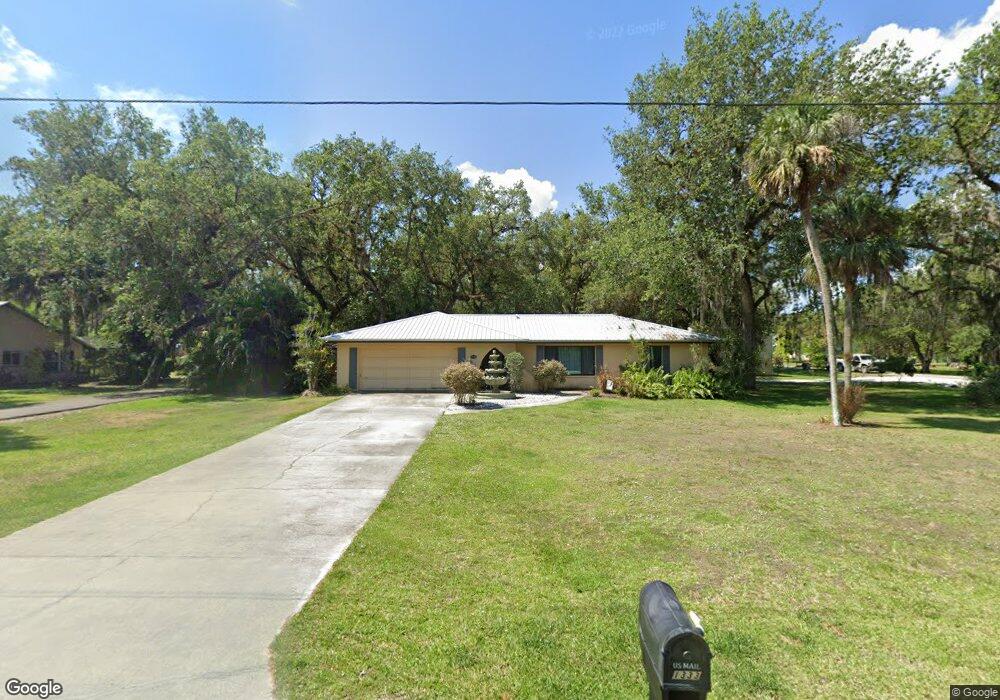
1333 Captain Hendry Dr Labelle, FL 33935
Estimated Value: $349,977 - $449,000
4
Beds
2
Baths
2,559
Sq Ft
$150/Sq Ft
Est. Value
About This Home
This home is located at 1333 Captain Hendry Dr, Labelle, FL 33935 and is currently estimated at $384,994, approximately $150 per square foot. 1333 Captain Hendry Dr is a home located in Hendry County with nearby schools including Community Christian School.
Ownership History
Date
Name
Owned For
Owner Type
Purchase Details
Closed on
Apr 29, 2022
Sold by
Burton Jeffrey G and Burton Paula I
Bought by
Jones Alex M and Jones Rhonda R
Current Estimated Value
Home Financials for this Owner
Home Financials are based on the most recent Mortgage that was taken out on this home.
Original Mortgage
$248,995
Outstanding Balance
$235,171
Interest Rate
5.1%
Mortgage Type
New Conventional
Estimated Equity
$149,823
Purchase Details
Closed on
Dec 30, 2016
Sold by
Dipofi Rena I and Burton Paula
Bought by
Burton Jeffrey G and Burotn Paula I
Home Financials for this Owner
Home Financials are based on the most recent Mortgage that was taken out on this home.
Original Mortgage
$127,500
Interest Rate
4.03%
Mortgage Type
New Conventional
Purchase Details
Closed on
Dec 1, 2016
Bought by
Burton Jeffrey G
Home Financials for this Owner
Home Financials are based on the most recent Mortgage that was taken out on this home.
Original Mortgage
$127,500
Interest Rate
4.03%
Mortgage Type
New Conventional
Purchase Details
Closed on
Nov 14, 2011
Sold by
Ireland Daisye P
Bought by
Burton Paula and Dipofi Reina I
Create a Home Valuation Report for This Property
The Home Valuation Report is an in-depth analysis detailing your home's value as well as a comparison with similar homes in the area
Home Values in the Area
Average Home Value in this Area
Purchase History
| Date | Buyer | Sale Price | Title Company |
|---|---|---|---|
| Jones Alex M | $262,100 | New Title Company Name | |
| Burton Jeffrey G | $95,000 | Attorney | |
| Burton Jeffrey G | $100 | -- | |
| Burton Paula | -- | None Available |
Source: Public Records
Mortgage History
| Date | Status | Borrower | Loan Amount |
|---|---|---|---|
| Open | Jones Alex M | $248,995 | |
| Previous Owner | Burton Jeffrey G | $127,500 |
Source: Public Records
Tax History
| Year | Tax Paid | Tax Assessment Tax Assessment Total Assessment is a certain percentage of the fair market value that is determined by local assessors to be the total taxable value of land and additions on the property. | Land | Improvement |
|---|---|---|---|---|
| 2025 | $4,472 | $276,935 | $42,907 | $234,028 |
| 2024 | $4,108 | $286,623 | -- | -- |
| 2023 | $4,108 | $259,589 | $39,176 | $220,413 |
| 2022 | $3,861 | $219,204 | $52,234 | $166,970 |
| 2021 | $3,634 | $191,084 | $37,310 | $153,774 |
| 2020 | $3,261 | $157,013 | $26,863 | $130,150 |
| 2019 | $3,131 | $150,025 | $26,863 | $123,162 |
| 2018 | $2,933 | $131,925 | $26,863 | $105,062 |
| 2017 | $3,115 | $137,931 | $0 | $0 |
| 2016 | $1,322 | $91,680 | $0 | $0 |
| 2015 | $1,327 | $91,040 | $0 | $0 |
| 2014 | $1,321 | $90,320 | $0 | $0 |
Source: Public Records
Map
Nearby Homes
- 385 Caloosa Dr
- 369 Caloosa Dr
- 639 Rope Bend Terrace Dr
- 2532 Caloosa Shores Dr
- 1724 Caloosa Estates Ct
- 671 Live Oak Ln
- 0 Florida 80 Unit 2025025301
- 0 Florida 80 Unit A11739226
- 0 Florida 80 Unit 225011892
- VAC Kissimmee Ave
- 980 W Hickpochee Ave
- 891 W Hickpochee Ave
- 0 Suwanee Ave
- 570 Live Oak Ln
- 1984 Florida 80
- 871 Caloosahatchee Ave
- 2014 Fort Denaud Rd
- 949 Caloosahatchee Ave
- 839 Caloosahatchee Ave
- 851 Caloosahatchee Ave
- 1301 Captain Hendry Dr
- 490 Caloosa Dr
- 510 Captain Hendry Dr
- 540 Captain Hendry Dr
- 1241 Captain Hendry Dr
- 470 Caloosa Dr
- 485 Caloosa Dr
- 570 Capt Hendry Dr
- 570 Captain Hendry Dr
- 450 Caloosa Dr
- 599 Captain Hendry Dr
- 1260 Captain Hendry Dr
- 446 Caloosa Dr
- 0 Caloosa Dr
- 584 Captain Hendry Dr
- 600 Captain Hendry Dr
- 1244 Captain Hendry Dr
- 440 Caloosa Dr
- 1216 Captain Hendry Dr
- 415 Caloosa Dr
Your Personal Tour Guide
Ask me questions while you tour the home.