Estimated Value: $25,226 - $189,000
3
Beds
1
Bath
1,104
Sq Ft
$128/Sq Ft
Est. Value
About This Home
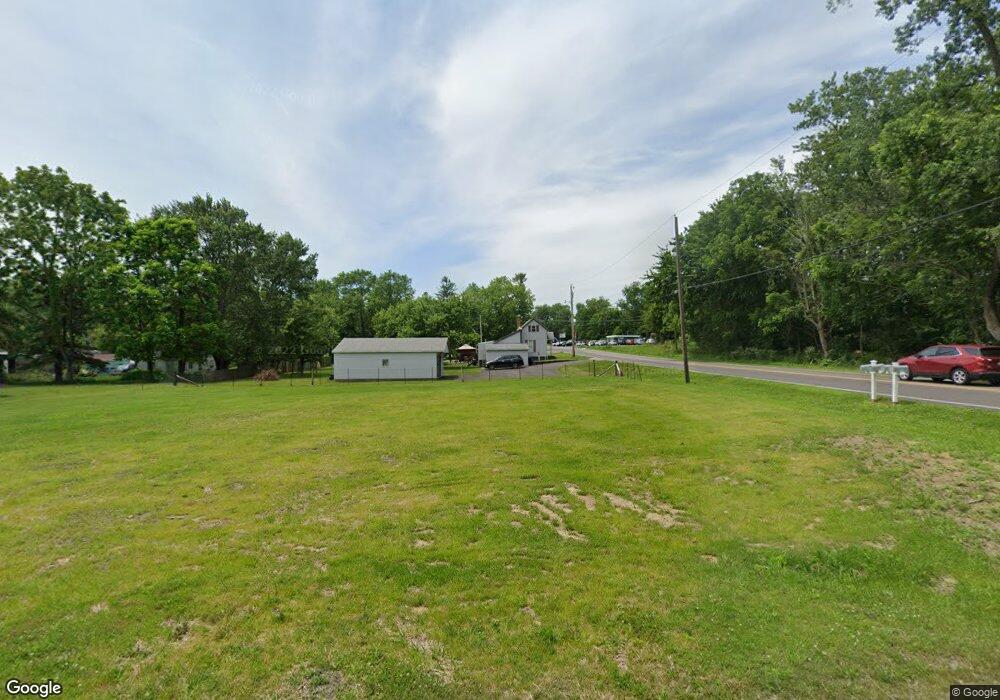
This home is located at 1333 E Main St, Xenia, OH 45385 and is currently estimated at $141,307, approximately $127 per square foot. 1333 E Main St is a home located in Greene County with nearby schools including Xenia High School, Summit Academy Community School for Alternative Learners - Xenia, and Legacy Christian Academy.
Ownership History
Date
Name
Owned For
Owner Type
Purchase Details
Closed on
Sep 13, 2021
Sold by
Greene County
Bought by
Xenia Township Board Of Trustees
Current Estimated Value
Purchase Details
Closed on
Jun 21, 2016
Bought by
State Of Ohio
Purchase Details
Closed on
Sep 19, 1997
Sold by
Hubbard Floyd J
Bought by
Nickles Bo
Home Financials for this Owner
Home Financials are based on the most recent Mortgage that was taken out on this home.
Original Mortgage
$34,125
Interest Rate
7.55%
Mortgage Type
New Conventional
Purchase Details
Closed on
Dec 2, 1994
Sold by
Hubbard Floyd J
Bought by
Nickles Clinnon B and Nickles Amber
Create a Home Valuation Report for This Property
The Home Valuation Report is an in-depth analysis detailing your home's value as well as a comparison with similar homes in the area
Home Values in the Area
Average Home Value in this Area
Purchase History
| Date | Buyer | Sale Price | Title Company |
|---|---|---|---|
| Xenia Township Board Of Trustees | $1,000 | None Available | |
| State Of Ohio | -- | -- | |
| Nickles Bo | $34,900 | -- | |
| Nickles Clinnon B | $39,400 | -- |
Source: Public Records
Mortgage History
| Date | Status | Borrower | Loan Amount |
|---|---|---|---|
| Previous Owner | Nickles Bo | $34,125 | |
| Closed | Nickles Clinnon B | $0 |
Source: Public Records
Tax History Compared to Growth
Tax History
| Year | Tax Paid | Tax Assessment Tax Assessment Total Assessment is a certain percentage of the fair market value that is determined by local assessors to be the total taxable value of land and additions on the property. | Land | Improvement |
|---|---|---|---|---|
| 2024 | $129 | $2,650 | $2,650 | $0 |
| 2023 | $129 | $2,650 | $2,650 | $0 |
| 2022 | $0 | $2,320 | $2,320 | $0 |
| 2021 | $12,942 | $3,850 | $2,320 | $1,530 |
| 2020 | $12,472 | $3,850 | $2,320 | $1,530 |
| 2019 | $578 | $10,390 | $2,320 | $8,070 |
| 2018 | $580 | $10,390 | $2,320 | $8,070 |
| 2017 | $1,179 | $10,390 | $2,320 | $8,070 |
| 2016 | $821 | $14,470 | $2,320 | $12,150 |
| 2015 | $12,847 | $14,470 | $2,320 | $12,150 |
| 2014 | $9,888 | $14,470 | $2,320 | $12,150 |
Source: Public Records
Map
Nearby Homes
- 1293 E Main St
- 0 N Patton St
- 00 N Patton St
- 612 E Market St
- 607 E Main St
- 0 Gultice Rd Unit 940427
- 1444 Triple Crown Way
- 454 E Church St
- 116 N Leach St
- 745 Doral Dr
- 610 Saxony Dr
- 447 S Stadium Dr
- 323 E Church St
- 479 N Stadium Dr
- 513 Redbud Ln
- 1239 Old U S 35
- 133 Hivling St
- 119 Park Dr
- 428 Wilson Dr
- 75 W 2nd St