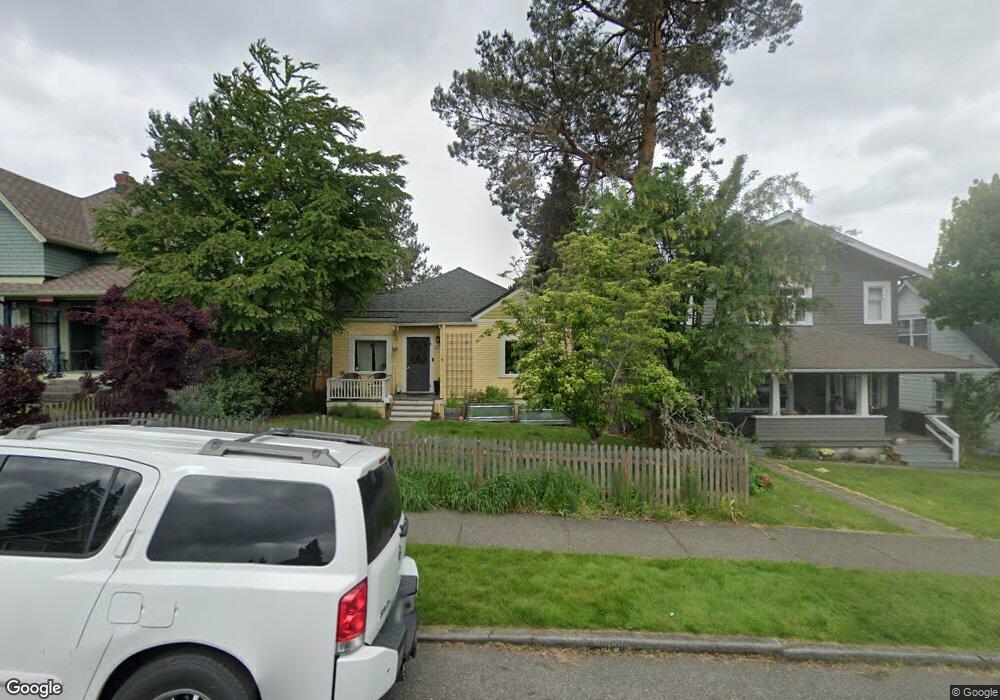
1333 Franklin St Bellingham, WA 98225
York NeighborhoodEstimated Value: $550,000 - $581,000
3
Beds
1
Bath
1,140
Sq Ft
$499/Sq Ft
Est. Value
About This Home
This home is located at 1333 Franklin St, Bellingham, WA 98225 and is currently estimated at $568,354, approximately $498 per square foot. 1333 Franklin St is a home located in Whatcom County with nearby schools including Lowell Elementary School, Fairhaven Middle School, and Sehome High School.
Ownership History
Date
Name
Owned For
Owner Type
Purchase Details
Closed on
Jun 23, 2006
Sold by
Quessenberry Patricia M
Bought by
Quessenberry Todd M and Quessenberry Kami L
Current Estimated Value
Home Financials for this Owner
Home Financials are based on the most recent Mortgage that was taken out on this home.
Original Mortgage
$176,000
Outstanding Balance
$100,846
Interest Rate
6.12%
Mortgage Type
Purchase Money Mortgage
Estimated Equity
$467,508
Purchase Details
Closed on
Aug 21, 2000
Sold by
Griemsmann Sharon and Griemsmann Edward H
Bought by
Quessenberry Patricia M
Home Financials for this Owner
Home Financials are based on the most recent Mortgage that was taken out on this home.
Original Mortgage
$98,920
Interest Rate
8.15%
Purchase Details
Closed on
Jul 6, 2000
Sold by
Bangs Lucy
Bought by
Griemsmann Edward H and Griemsmann Sharon
Home Financials for this Owner
Home Financials are based on the most recent Mortgage that was taken out on this home.
Original Mortgage
$98,920
Interest Rate
8.15%
Create a Home Valuation Report for This Property
The Home Valuation Report is an in-depth analysis detailing your home's value as well as a comparison with similar homes in the area
Home Values in the Area
Average Home Value in this Area
Purchase History
| Date | Buyer | Sale Price | Title Company |
|---|---|---|---|
| Quessenberry Todd M | $220,280 | Chicago Title Insurance | |
| Quessenberry Patricia M | $123,650 | Island Title | |
| Griemsmann Edward H | $100,000 | Island Title |
Source: Public Records
Mortgage History
| Date | Status | Borrower | Loan Amount |
|---|---|---|---|
| Open | Quessenberry Todd M | $176,000 | |
| Previous Owner | Quessenberry Patricia M | $98,920 | |
| Previous Owner | Griemsmann Edward H | $80,000 |
Source: Public Records
Tax History Compared to Growth
Tax History
| Year | Tax Paid | Tax Assessment Tax Assessment Total Assessment is a certain percentage of the fair market value that is determined by local assessors to be the total taxable value of land and additions on the property. | Land | Improvement |
|---|---|---|---|---|
| 2024 | $4,424 | $554,321 | $277,092 | $277,229 |
| 2023 | $4,424 | $568,400 | $284,130 | $284,270 |
| 2022 | $3,612 | $490,009 | $244,944 | $245,065 |
| 2021 | $3,544 | $388,896 | $194,400 | $194,496 |
| 2020 | $3,318 | $360,089 | $180,000 | $180,089 |
| 2019 | $2,971 | $325,892 | $139,751 | $186,141 |
| 2018 | $2,992 | $292,538 | $125,471 | $167,067 |
| 2017 | $2,580 | $251,866 | $108,024 | $143,842 |
| 2016 | $2,258 | $226,977 | $96,936 | $130,041 |
| 2015 | $2,214 | $206,796 | $88,536 | $118,260 |
| 2014 | -- | $196,201 | $84,000 | $112,201 |
| 2013 | -- | $191,168 | $78,750 | $112,418 |
Source: Public Records
Map
Nearby Homes
- 1309 Billy Frank Jr St
- 1234 Grant St
- 5 XX Gladstone St
- 1126 N Forest St
- 1470 James St
- 1205 E Maple St
- 910 Gladstone St Unit 205
- 1031 N State St Unit 107
- 1031 N State St Unit 209
- 615 E Myrtle St
- 1001 N State St Unit 403
- 616 E Myrtle St
- 1015 Railroad Ave Unit 418
- 1724 Iron St
- 819 High St Unit 317
- 901 N Forest St Unit 107
- 901 N Forest St Unit 125
- 901 N Forest St Unit 109
- 1200 Lincoln St Unit 196
- 1200 Lincoln St Unit 117
- 1323 Franklin St
- 1335 Franklin St
- 1319 Franklin St
- 1337 Franklin St
- 1315 Franklin St
- 1339 Franklin St
- 1324 Ellis St
- 1320 Ellis St
- 1330 Ellis St
- 1334 Ellis St
- 1310 Ellis St
- 1311 Franklin St
- 1338 Ellis St
- 1377 Franklin St
- 1324 Franklin St
- 1328 Franklin St
- 1320 Franklin St
- 1306 Ellis St
- 1349 Franklin St
- 1340 Ellis St