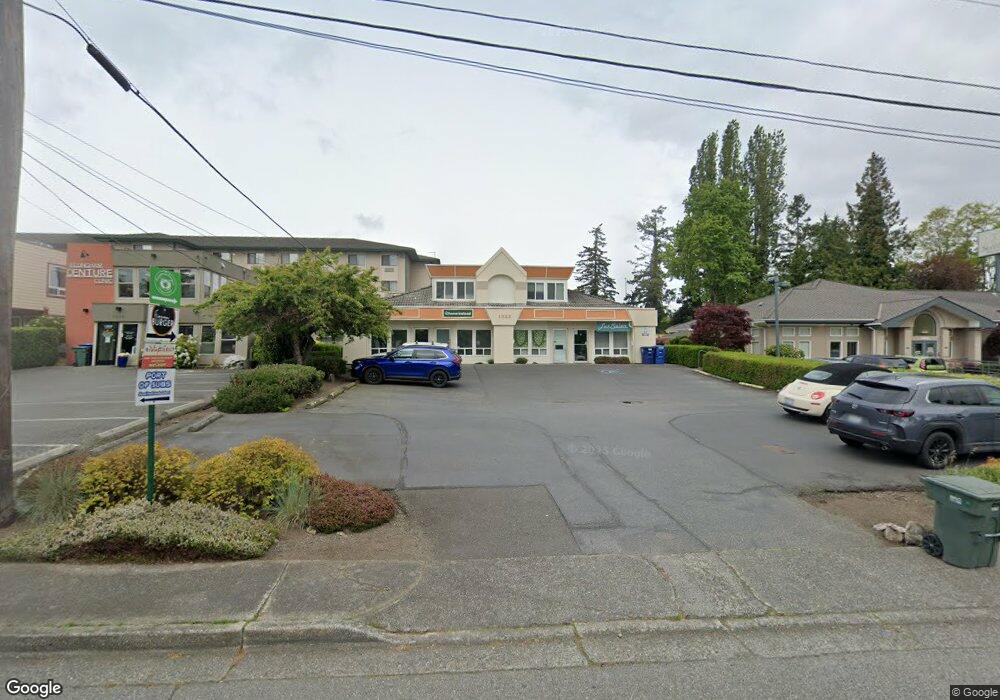
1333 King St Bellingham, WA 98229
Puget NeighborhoodEstimated Value: $1,366,427
--
Bed
--
Bath
3,904
Sq Ft
$350/Sq Ft
Est. Value
About This Home
This home is located at 1333 King St, Bellingham, WA 98229 and is currently estimated at $1,366,427, approximately $350 per square foot. 1333 King St is a home located in Whatcom County with nearby schools including Carl Cozier Elementary School, Kulshan Middle School, and Sehome High School.
Ownership History
Date
Name
Owned For
Owner Type
Purchase Details
Closed on
Mar 4, 2013
Sold by
William Enterprises Llc
Bought by
Shahi Balwinder S and Shahi Gurmeet K
Current Estimated Value
Home Financials for this Owner
Home Financials are based on the most recent Mortgage that was taken out on this home.
Original Mortgage
$340,000
Outstanding Balance
$239,820
Interest Rate
3.53%
Mortgage Type
Future Advance Clause Open End Mortgage
Estimated Equity
$1,126,607
Purchase Details
Closed on
May 14, 2003
Sold by
Williamson Fred A and Williamson Deborah L
Bought by
Williamson Enterprises Llc
Purchase Details
Closed on
Jun 11, 2001
Sold by
Williamson Fred and Williamson Deborah
Bought by
Williamson Fred A and Williamson Deborah L
Purchase Details
Closed on
Dec 11, 2000
Sold by
Kumar Ravi
Bought by
Williamson Fred and Williamson Deborah
Home Financials for this Owner
Home Financials are based on the most recent Mortgage that was taken out on this home.
Original Mortgage
$200,000
Interest Rate
7.67%
Mortgage Type
Commercial
Create a Home Valuation Report for This Property
The Home Valuation Report is an in-depth analysis detailing your home's value as well as a comparison with similar homes in the area
Home Values in the Area
Average Home Value in this Area
Purchase History
| Date | Buyer | Sale Price | Title Company |
|---|---|---|---|
| Shahi Balwinder S | $513,020 | Chicago Title Insurance | |
| Williamson Enterprises Llc | -- | -- | |
| Williamson Fred A | -- | -- | |
| Williamson Fred | $307,000 | First American Title Ins |
Source: Public Records
Mortgage History
| Date | Status | Borrower | Loan Amount |
|---|---|---|---|
| Open | Shahi Balwinder S | $340,000 | |
| Previous Owner | Williamson Fred | $200,000 | |
| Closed | Williamson Fred | $200,000 |
Source: Public Records
Tax History Compared to Growth
Tax History
| Year | Tax Paid | Tax Assessment Tax Assessment Total Assessment is a certain percentage of the fair market value that is determined by local assessors to be the total taxable value of land and additions on the property. | Land | Improvement |
|---|---|---|---|---|
| 2024 | $6,077 | $780,911 | $284,746 | $496,165 |
| 2023 | $6,077 | $780,911 | $284,746 | $496,165 |
| 2022 | $5,685 | $709,919 | $258,860 | $451,059 |
| 2021 | $6,023 | $611,999 | $223,155 | $388,844 |
| 2020 | $6,232 | $611,999 | $223,155 | $388,844 |
| 2019 | $5,580 | $611,999 | $223,155 | $388,844 |
| 2018 | $6,111 | $549,489 | $197,550 | $351,939 |
| 2017 | $5,377 | $514,500 | $184,971 | $329,529 |
| 2016 | $5,165 | $473,119 | $170,094 | $303,025 |
| 2015 | $5,188 | $473,119 | $170,094 | $303,025 |
| 2014 | -- | $459,785 | $165,300 | $294,485 |
| 2013 | -- | $459,785 | $165,300 | $294,485 |
Source: Public Records
Map
Nearby Homes
- 1234 Grant St
- 1342 Franklin St
- 1211 Humboldt St
- 1356 Orleans St
- 1501 Lakeway Dr
- 1227 Puget St
- 1200 Lincoln St Unit 196
- 1200 Lincoln St Unit 424
- 1200 Lincoln St Unit 117
- 1200 Lincoln St Unit 154
- 1125 Otis St
- 1724 Iron St
- 617 E Chestnut St
- 1205 E Maple St
- 2728 Humboldt St
- 1117 W Racine St
- 1401 Edwards St
- 1040 Puget St
- 1126 N Forest St
- 0 Lopez St
- 1329 King St
- 1321 King St Unit 4
- 1321 King St
- 1321 2ndFloor King St Unit 4
- 1344 King St
- 1329 Lincoln St
- 1337 Lincoln St
- 1333 Lincoln St
- 1325 Lincoln St
- 1323 Lincoln St
- 1340 Iron St
- 1350 Iron St
- 1336 Iron St
- 913 Lakeway Dr
- 1400 Iron St
- 1408 Iron St
- 1401 James St
- 921 Lakeway Dr
- 1410 Iron St
- 1414 Iron St