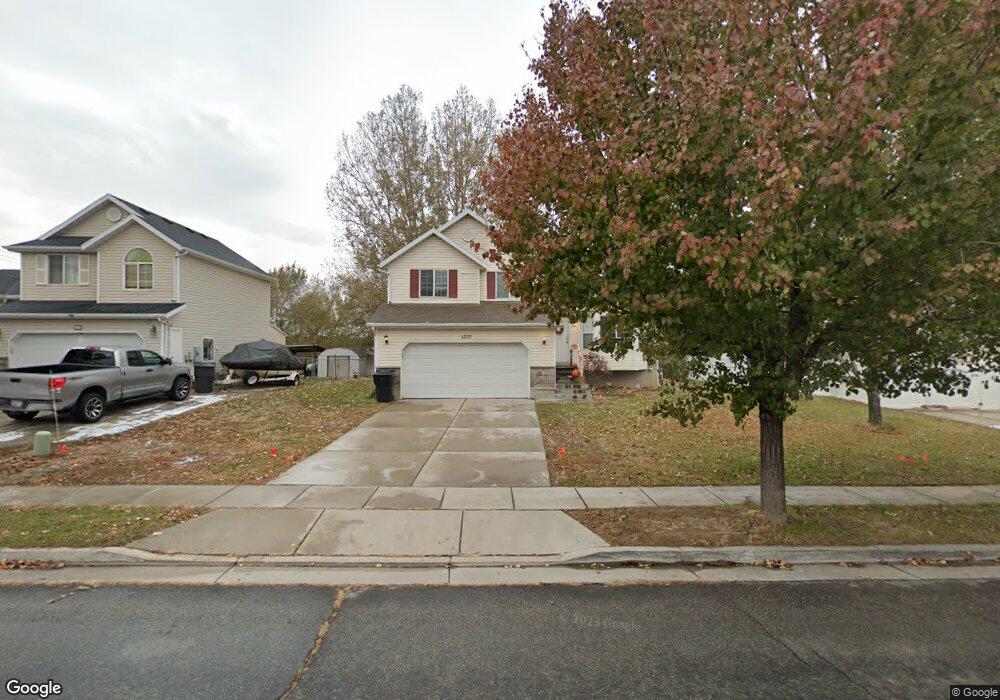
1333 N 950 W Clearfield, UT 84015
Estimated Value: $447,987 - $498,000
3
Beds
2
Baths
1,813
Sq Ft
$258/Sq Ft
Est. Value
About This Home
This home is located at 1333 N 950 W, Clearfield, UT 84015 and is currently estimated at $468,247, approximately $258 per square foot. 1333 N 950 W is a home located in Davis County with nearby schools including Clinton Elementary School, Sunset Junior High School, and Clearfield High School.
Ownership History
Date
Name
Owned For
Owner Type
Purchase Details
Closed on
Feb 26, 2013
Sold by
Jarman James and Jarman Sarah
Bought by
American Homes 4 Rent Properties Three L
Current Estimated Value
Purchase Details
Closed on
Oct 11, 2006
Sold by
Stillman Jason C and Stillman Shelli L
Bought by
Jarman James and Jarman Sarah
Purchase Details
Closed on
May 17, 2000
Sold by
Gmw Development Inc
Bought by
Stillman Jason C and Stillman Shelli L
Home Financials for this Owner
Home Financials are based on the most recent Mortgage that was taken out on this home.
Original Mortgage
$136,502
Interest Rate
8.22%
Mortgage Type
FHA
Create a Home Valuation Report for This Property
The Home Valuation Report is an in-depth analysis detailing your home's value as well as a comparison with similar homes in the area
Home Values in the Area
Average Home Value in this Area
Purchase History
| Date | Buyer | Sale Price | Title Company |
|---|---|---|---|
| American Homes 4 Rent Properties Three L | -- | Inwest Title Services Inc | |
| Jarman James | -- | Bonneville Superior Title Co | |
| Stillman Jason C | -- | Bonneville Title Company Inc |
Source: Public Records
Mortgage History
| Date | Status | Borrower | Loan Amount |
|---|---|---|---|
| Previous Owner | Stillman Jason C | $136,502 |
Source: Public Records
Tax History Compared to Growth
Tax History
| Year | Tax Paid | Tax Assessment Tax Assessment Total Assessment is a certain percentage of the fair market value that is determined by local assessors to be the total taxable value of land and additions on the property. | Land | Improvement |
|---|---|---|---|---|
| 2025 | $2,357 | $226,600 | $86,993 | $139,607 |
| 2024 | $2,384 | $230,450 | $95,964 | $134,486 |
| 2023 | $2,197 | $216,150 | $59,722 | $156,427 |
| 2022 | $2,341 | $421,000 | $122,101 | $298,899 |
| 2021 | $2,133 | $313,000 | $82,833 | $230,167 |
| 2020 | $1,852 | $269,000 | $69,736 | $199,264 |
| 2019 | $1,797 | $255,000 | $82,697 | $172,303 |
| 2018 | $1,671 | $233,000 | $70,008 | $162,992 |
| 2016 | $1,549 | $111,540 | $27,124 | $84,416 |
| 2015 | $1,450 | $99,220 | $27,124 | $72,096 |
| 2014 | $1,397 | $97,137 | $27,124 | $70,013 |
| 2013 | -- | $88,816 | $27,143 | $61,673 |
Source: Public Records
Map
Nearby Homes