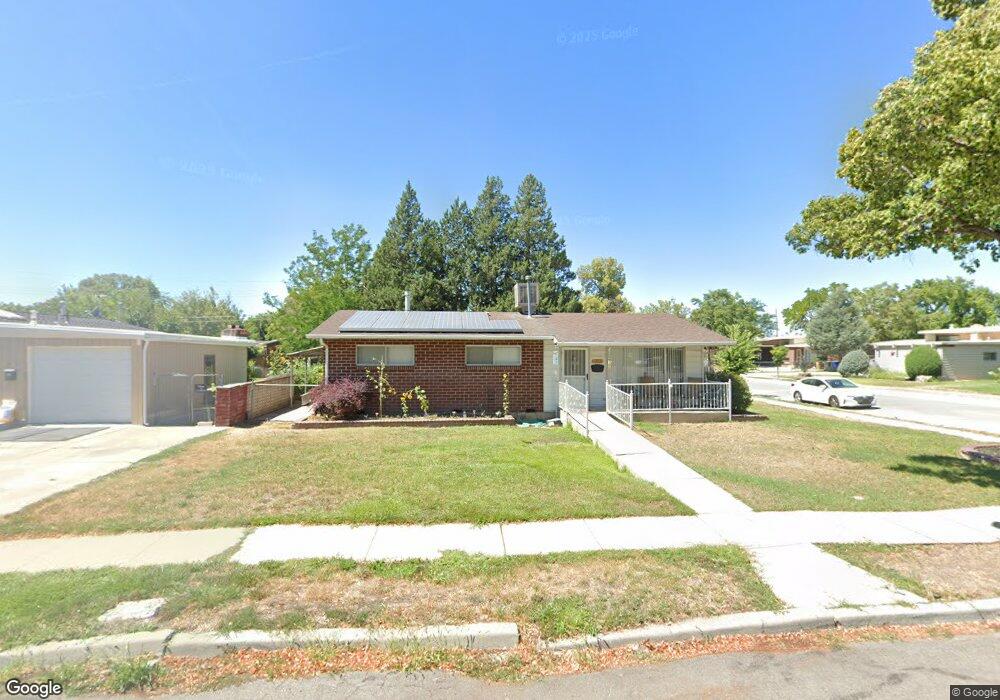
1333 N Nocturne Dr Salt Lake City, UT 84116
Rose Park NeighborhoodEstimated Value: $457,000 - $475,000
4
Beds
2
Baths
1,843
Sq Ft
$254/Sq Ft
Est. Value
About This Home
This home is located at 1333 N Nocturne Dr, Salt Lake City, UT 84116 and is currently estimated at $468,457, approximately $254 per square foot. 1333 N Nocturne Dr is a home located in Salt Lake County with nearby schools including Newman Elementary School, Northwest Middle School, and West High.
Ownership History
Date
Name
Owned For
Owner Type
Purchase Details
Closed on
Oct 4, 2023
Sold by
Ru Pool 2 Llc
Bought by
Bright Bradley and Bright Sylvia
Current Estimated Value
Home Financials for this Owner
Home Financials are based on the most recent Mortgage that was taken out on this home.
Original Mortgage
$95,000
Outstanding Balance
$93,170
Interest Rate
7.23%
Mortgage Type
New Conventional
Estimated Equity
$375,287
Purchase Details
Closed on
Sep 27, 2019
Sold by
Restore Utah Llc
Bought by
Ru Pool 2 Llc
Home Financials for this Owner
Home Financials are based on the most recent Mortgage that was taken out on this home.
Original Mortgage
$46,485,880
Interest Rate
3.5%
Mortgage Type
Commercial
Purchase Details
Closed on
Dec 20, 2012
Sold by
Barnhart Connie
Bought by
Restore Utah Llc
Purchase Details
Closed on
Jul 28, 2008
Sold by
Neeley Marian L and Neeley Cyral M
Bought by
Neeley Marian L and Marian L Neeley Family Living Trust
Purchase Details
Closed on
Nov 24, 1998
Sold by
Venz Marian L and Neeley Marian L
Bought by
Neeley Marian L and Neeley Cyral M
Create a Home Valuation Report for This Property
The Home Valuation Report is an in-depth analysis detailing your home's value as well as a comparison with similar homes in the area
Home Values in the Area
Average Home Value in this Area
Purchase History
| Date | Buyer | Sale Price | Title Company |
|---|---|---|---|
| Bright Bradley | -- | Integrated Title Services | |
| Ru Pool 2 Llc | -- | Integrated Title Ins Svcs | |
| Restore Utah Llc | -- | Bonneville Superior Title | |
| Neeley Marian L | -- | None Available | |
| Neeley Marian L | -- | -- |
Source: Public Records
Mortgage History
| Date | Status | Borrower | Loan Amount |
|---|---|---|---|
| Open | Bright Bradley | $95,000 | |
| Previous Owner | Ru Pool 2 Llc | $46,485,880 |
Source: Public Records
Tax History Compared to Growth
Tax History
| Year | Tax Paid | Tax Assessment Tax Assessment Total Assessment is a certain percentage of the fair market value that is determined by local assessors to be the total taxable value of land and additions on the property. | Land | Improvement |
|---|---|---|---|---|
| 2025 | $2,193 | $441,500 | $128,200 | $313,300 |
| 2024 | $2,193 | $418,400 | $121,400 | $297,000 |
| 2023 | $1,992 | $366,400 | $116,700 | $249,700 |
| 2022 | $2,152 | $371,400 | $114,400 | $257,000 |
| 2021 | $1,861 | $290,700 | $86,800 | $203,900 |
| 2020 | $1,789 | $266,100 | $77,400 | $188,700 |
| 2019 | $1,857 | $259,800 | $70,900 | $188,900 |
| 2018 | $1,580 | $215,300 | $70,900 | $144,400 |
| 2017 | $1,590 | $202,900 | $70,900 | $132,000 |
| 2016 | $1,597 | $193,600 | $59,700 | $133,900 |
| 2015 | $1,285 | $147,600 | $56,700 | $90,900 |
| 2014 | $1,204 | $137,200 | $55,500 | $81,700 |
Source: Public Records
Map
Nearby Homes
- 1250 Buccaneer Dr
- 1305 N Valentine St
- 1284 Sonata St
- 1320 W Sunset Dr
- 1260 W 1100 N
- 1366 Dupont Ave
- 1379 Dupont Ave
- 1210 W 1000 N
- 1118 N 1400 W
- 945 N 1200 W
- 949 N Oakley St
- 1301 N 1500 W
- 565 N 1200 W
- 866 American Beauty Dr
- 873 N American Beauty Dr
- 876 N 1300 W
- 955 Catherine St W
- 1281 Carousel St
- 848 Poinsettia Dr
- 793 N 1200 W
- 1333 Nocturne Dr
- 1319 Nocturne Dr
- 1319 N Nocturne Dr
- 1334 Capistrano Dr
- 1334 N Capistrano Dr
- 1322 Capistrano Dr
- 1322 N Capistrano Dr
- 1307 Nocturne Dr
- 1112 Dupont Ave
- 1334 Nocturne Dr
- 1312 Capistrano Dr
- 1312 N Capistrano Dr
- 1320 N Nocturne Dr
- 1320 Nocturne Dr
- 1100 Dupont Ave
- 1295 Nocturne Dr
- 1308 N Nocturne Dr
- 1308 Nocturne Dr
- 1130 W Dupont Ave
- 1300 N Capistrano Dr