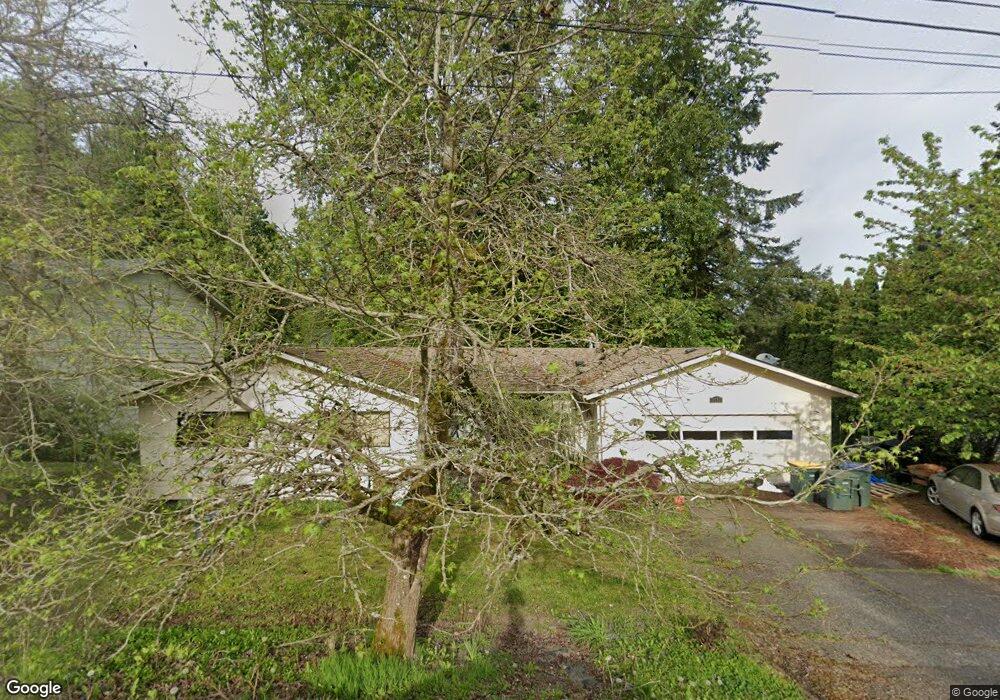
1333 Portal Dr Bellingham, WA 98229
Whatcom Falls NeighborhoodEstimated Value: $641,000 - $763,000
3
Beds
2
Baths
1,453
Sq Ft
$481/Sq Ft
Est. Value
About This Home
This home is located at 1333 Portal Dr, Bellingham, WA 98229 and is currently estimated at $698,317, approximately $480 per square foot. 1333 Portal Dr is a home located in Whatcom County with nearby schools including Carl Cozier Elementary School, Kulshan Middle School, and Sehome High School.
Ownership History
Date
Name
Owned For
Owner Type
Purchase Details
Closed on
Mar 8, 2012
Sold by
Eidemiller Jack
Bought by
Smith Kristopher
Current Estimated Value
Home Financials for this Owner
Home Financials are based on the most recent Mortgage that was taken out on this home.
Original Mortgage
$199,803
Outstanding Balance
$136,462
Interest Rate
3.75%
Mortgage Type
FHA
Estimated Equity
$561,855
Purchase Details
Closed on
Apr 9, 2003
Sold by
Winningham Mark W
Bought by
Eidemiller Jack
Purchase Details
Closed on
Dec 16, 2002
Sold by
Winningham Mark W
Bought by
Winningham Mark W
Home Financials for this Owner
Home Financials are based on the most recent Mortgage that was taken out on this home.
Original Mortgage
$40,000
Interest Rate
5.86%
Mortgage Type
Balloon
Create a Home Valuation Report for This Property
The Home Valuation Report is an in-depth analysis detailing your home's value as well as a comparison with similar homes in the area
Home Values in the Area
Average Home Value in this Area
Purchase History
| Date | Buyer | Sale Price | Title Company |
|---|---|---|---|
| Smith Kristopher | $205,280 | First American Title Ins | |
| Eidemiller Jack | -- | Stewart Title Company | |
| Winningham Mark W | -- | Whatcom Land Title |
Source: Public Records
Mortgage History
| Date | Status | Borrower | Loan Amount |
|---|---|---|---|
| Open | Smith Kristopher | $199,803 | |
| Previous Owner | Winningham Mark W | $40,000 |
Source: Public Records
Tax History Compared to Growth
Tax History
| Year | Tax Paid | Tax Assessment Tax Assessment Total Assessment is a certain percentage of the fair market value that is determined by local assessors to be the total taxable value of land and additions on the property. | Land | Improvement |
|---|---|---|---|---|
| 2024 | $4,350 | $544,939 | $262,466 | $282,473 |
| 2023 | $4,350 | $558,813 | $269,148 | $289,665 |
| 2022 | $3,437 | $473,580 | $228,096 | $245,484 |
| 2021 | $3,372 | $369,984 | $178,200 | $191,784 |
| 2020 | $3,019 | $342,578 | $165,000 | $177,578 |
| 2019 | $2,844 | $296,521 | $125,800 | $170,721 |
| 2018 | $2,865 | $280,059 | $118,881 | $161,178 |
| 2017 | $2,495 | $241,234 | $102,170 | $139,064 |
| 2016 | $2,229 | $219,532 | $92,905 | $126,627 |
| 2015 | $2,235 | $204,200 | $87,635 | $116,565 |
| 2014 | -- | $198,060 | $85,000 | $113,060 |
| 2013 | -- | $205,928 | $79,650 | $126,278 |
Source: Public Records
Map
Nearby Homes
- 0 Bonanza Way Unit NWM2327531
- 1328 Parkstone Ln
- 1120 Birch Falls Dr
- 4000 Flynn St Unit 50
- 4000 Flynn St Unit 107
- 1211 Kenoyer Dr
- 0 US Highway 27 Hwy N Unit MFRP4936152
- 0 US Highway 27 Hwy N Unit MFRP4935974
- 0 US Highway 27 Hwy N Unit MFRO6335808
- 0 US Highway 27 Hwy N Unit MFRL4957889
- 0 US Highway 27 Hwy N Unit MFRL4952111
- 2104 Birch Cir Unit 5C
- 2209 W Birch St
- 1402 Langara Cir
- 2501 Fireweed Ln
- 2321 Crestline Dr
- 0 Princeton Ct
- 1142 Whidbey St
- 1146 Whidbey St
- 1101 Whidbey St
- 1329 Portal Dr
- 3622 Lakeway Dr
- 1403 Portal Dr
- 1325 Portal Dr
- 3700 Lakeway Dr
- 3618 Lakeway Dr
- 1330 Portal Dr
- 3701 Lakeway Dr
- 3612 Lakeway Dr
- 3619 Lakeway Dr
- 1321 Portal Dr
- 1328 Portal Dr
- 1411 Portal Dr
- 3708 Lakeway Dr
- 1410 Portal Dr
- 1324 Portal Dr
- 3608 Lakeway Dr
- 1317 Portal Dr
- 1415 Portal Dr
- 3705 Lakeway Dr