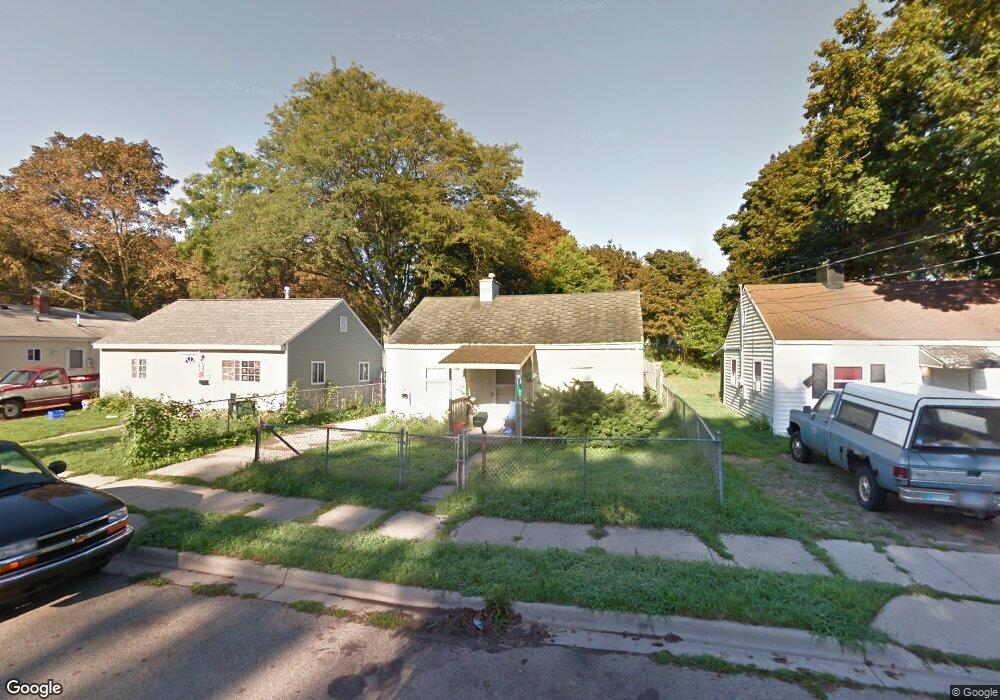
1333 Roosevelt Ave Lansing, MI 48915
Knollwood Willow NeighborhoodEstimated Value: $65,000 - $90,000
3
Beds
1
Bath
720
Sq Ft
$104/Sq Ft
Est. Value
About This Home
This home is located at 1333 Roosevelt Ave, Lansing, MI 48915 and is currently estimated at $74,905, approximately $104 per square foot. 1333 Roosevelt Ave is a home located in Ingham County with nearby schools including Willow School, Pattengill Academy, and J.W. Sexton High School.
Ownership History
Date
Name
Owned For
Owner Type
Purchase Details
Closed on
Oct 11, 2021
Sold by
Schertzing Eric A
Bought by
Njai Baboucarr
Current Estimated Value
Purchase Details
Closed on
Mar 28, 2017
Sold by
1333 Roosevelt Llc
Bought by
Esser Smith Properties Llc
Purchase Details
Closed on
Dec 31, 2008
Sold by
Ausel Harty J and Ausel Sarah
Bought by
1333 Roosevelt Llc
Purchase Details
Closed on
Sep 18, 2008
Sold by
Ausel Harty J and Ausel Sarah
Bought by
1113 Roosevelt Llc
Purchase Details
Closed on
Aug 27, 2008
Sold by
Munro Doug and Monro Julie
Bought by
Ausel Harty
Purchase Details
Closed on
Apr 17, 2001
Sold by
Hover Donald L and Hover Lindy L
Bought by
Munro Doug
Home Financials for this Owner
Home Financials are based on the most recent Mortgage that was taken out on this home.
Original Mortgage
$44,000
Interest Rate
6.99%
Mortgage Type
Purchase Money Mortgage
Purchase Details
Closed on
Mar 1, 1995
Purchase Details
Closed on
Mar 21, 1994
Sold by
Hover Donald
Bought by
Munro Doug
Create a Home Valuation Report for This Property
The Home Valuation Report is an in-depth analysis detailing your home's value as well as a comparison with similar homes in the area
Home Values in the Area
Average Home Value in this Area
Purchase History
| Date | Buyer | Sale Price | Title Company |
|---|---|---|---|
| Njai Baboucarr | $27,000 | None Available | |
| Njai Baboucarr | $27,000 | None Listed On Document | |
| Esser Smith Properties Llc | $7,500 | None Available | |
| 1333 Roosevelt Llc | -- | None Available | |
| 1113 Roosevelt Llc | -- | None Available | |
| Ausel Harty | $20,000 | None Available | |
| Munro Doug | $29,000 | -- | |
| -- | $29,000 | -- | |
| Munro Doug | $29,000 | -- |
Source: Public Records
Mortgage History
| Date | Status | Borrower | Loan Amount |
|---|---|---|---|
| Previous Owner | Munro Doug | $44,000 |
Source: Public Records
Tax History
| Year | Tax Paid | Tax Assessment Tax Assessment Total Assessment is a certain percentage of the fair market value that is determined by local assessors to be the total taxable value of land and additions on the property. | Land | Improvement |
|---|---|---|---|---|
| 2025 | $4,177 | $31,400 | $3,600 | $27,800 |
| 2024 | $30 | $27,000 | $3,600 | $23,400 |
| 2023 | $2,993 | $24,500 | $3,600 | $20,900 |
| 2022 | $2,004 | $22,100 | $3,700 | $18,400 |
| 2021 | $1,813 | $17,100 | $4,300 | $12,800 |
| 2020 | $3,909 | $15,100 | $4,300 | $10,800 |
| 2019 | $7,878 | $14,300 | $4,300 | $10,000 |
| 2018 | $5,445 | $12,800 | $4,300 | $8,500 |
| 2017 | $2,997 | $12,800 | $4,300 | $8,500 |
| 2016 | $1,001 | $12,600 | $4,300 | $8,300 |
| 2015 | $1,001 | $12,300 | $8,510 | $3,790 |
| 2014 | $1,001 | $12,600 | $10,000 | $2,600 |
Source: Public Records
Map
Nearby Homes
- 1315 Roosevelt Ave
- 1335 N Martin Luther King Junior Blvd
- 1130 Theodore St
- 1218 Linwood St
- 1441 Knollwood Ave
- 1224 Theodore St
- 933 N Martin Luther King Junior Blvd
- 1019 Daleford Ave
- 919 Princeton Ave
- 1544 Lansing Ave
- 1408 Glenrose Ave
- 1522 Robertson Ave
- 920 Clyde St
- 921 N Sycamore St
- 1310 W Maple St
- 1527 Robertson Ave
- 1615 Roseneath Ave
- 1418 Keeney Ct
- 814 N Martin Luther King jr Blvd
- 610 Bluff St
- 1335 Roosevelt Ave
- 1331 Roosevelt Ave
- 1329 Roosevelt Ave
- 1347 Roosevelt Ave
- 1321 Roosevelt Ave
- 1330 Lansing Ave
- 1326 Lansing Ave
- 1334 Lansing Ave
- 1319 Roosevelt Ave
- 1324 Lansing Ave
- 1340 Lansing Ave
- 1351 Roosevelt Ave
- 1317 Roosevelt Ave
- 1330 Roosevelt Ave
- 1332 Roosevelt Ave
- 1328 Roosevelt Ave
- 1336 Roosevelt Ave
- 1318 Lansing Ave
- 1326 Roosevelt Ave
Your Personal Tour Guide
Ask me questions while you tour the home.