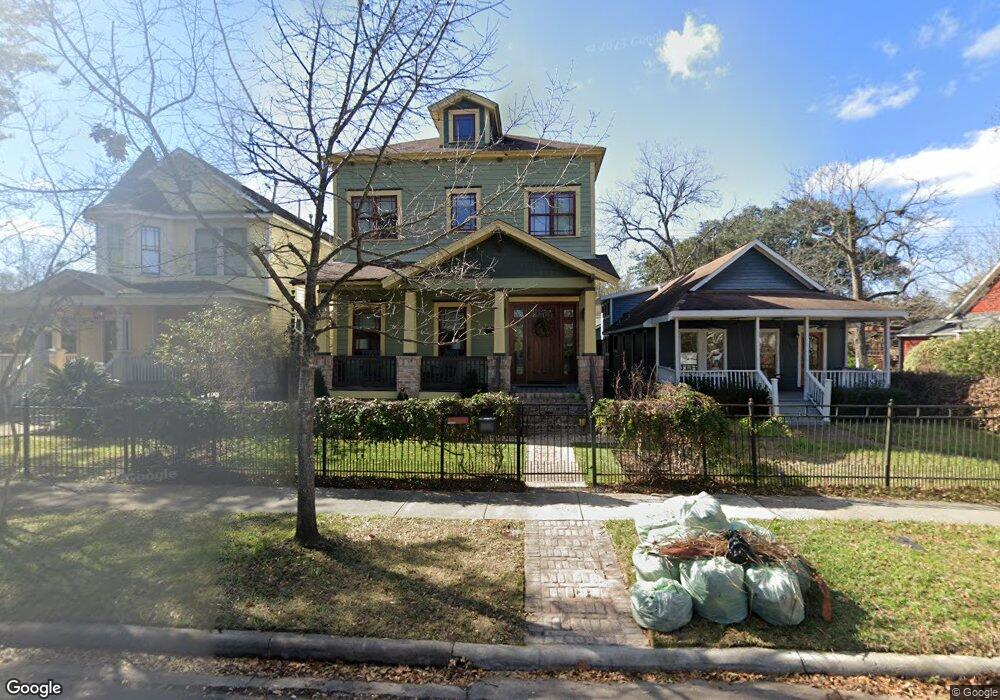
1333 Rutland St Houston, TX 77008
Greater Heights NeighborhoodEstimated Value: $1,146,000 - $1,423,287
3
Beds
5
Baths
3,590
Sq Ft
$368/Sq Ft
Est. Value
About This Home
This home is located at 1333 Rutland St, Houston, TX 77008 and is currently estimated at $1,322,822, approximately $368 per square foot. 1333 Rutland St is a home located in Harris County with nearby schools including Love Elementary School, Hamilton Middle, and Heights High School.
Ownership History
Date
Name
Owned For
Owner Type
Purchase Details
Closed on
Dec 4, 2017
Sold by
Sesler Jill P and Sesler Smaue
Bought by
Hasou Andre Joseph and Hasou Deborah Ann
Current Estimated Value
Home Financials for this Owner
Home Financials are based on the most recent Mortgage that was taken out on this home.
Original Mortgage
$799,950
Outstanding Balance
$662,573
Interest Rate
3.33%
Mortgage Type
Adjustable Rate Mortgage/ARM
Estimated Equity
$660,249
Purchase Details
Closed on
May 26, 2011
Sold by
Baldwin Scotty G and Baldwin Martha M
Bought by
Sisler Jill P and Sisler Samuel
Home Financials for this Owner
Home Financials are based on the most recent Mortgage that was taken out on this home.
Original Mortgage
$108,000
Interest Rate
4.85%
Mortgage Type
Future Advance Clause Open End Mortgage
Purchase Details
Closed on
Oct 31, 2000
Sold by
Johnson Frances E
Bought by
Guillen Jose
Purchase Details
Closed on
Jul 15, 1998
Sold by
Duong Sang Ngoc and Nguyen Tuoi Thi
Bought by
Royal Beechnut Apartments Inc
Create a Home Valuation Report for This Property
The Home Valuation Report is an in-depth analysis detailing your home's value as well as a comparison with similar homes in the area
Home Values in the Area
Average Home Value in this Area
Purchase History
| Date | Buyer | Sale Price | Title Company |
|---|---|---|---|
| Hasou Andre Joseph | -- | Select Title Llc | |
| Sisler Jill P | -- | Etc | |
| Guillen Jose | -- | -- | |
| Royal Beechnut Apartments Inc | -- | -- |
Source: Public Records
Mortgage History
| Date | Status | Borrower | Loan Amount |
|---|---|---|---|
| Open | Hasou Andre Joseph | $799,950 | |
| Previous Owner | Sisler Jill P | $108,000 |
Source: Public Records
Tax History Compared to Growth
Tax History
| Year | Tax Paid | Tax Assessment Tax Assessment Total Assessment is a certain percentage of the fair market value that is determined by local assessors to be the total taxable value of land and additions on the property. | Land | Improvement |
|---|---|---|---|---|
| 2025 | $20,483 | $1,330,708 | $392,040 | $938,668 |
| 2024 | $20,483 | $1,273,333 | $392,040 | $881,293 |
| 2023 | $20,483 | $1,382,641 | $392,040 | $990,601 |
| 2022 | $26,089 | $1,184,830 | $326,700 | $858,130 |
| 2021 | $25,490 | $1,093,692 | $291,852 | $801,840 |
| 2020 | $25,382 | $1,048,146 | $291,852 | $756,294 |
| 2019 | $24,207 | $966,022 | $283,140 | $682,882 |
| 2018 | $17,390 | $869,658 | $261,360 | $608,298 |
| 2017 | $18,711 | $740,000 | $261,360 | $478,640 |
| 2016 | $20,553 | $826,000 | $350,222 | $475,778 |
| 2015 | $13,708 | $818,400 | $291,852 | $526,548 |
| 2014 | $13,708 | $0 | $0 | $0 |
Source: Public Records
Map
Nearby Homes
- 1235 Tulane St
- 1325 Ashland St
- 1314 Allston St
- 219 W 13th St
- 1203 Tulane St
- 1342 Allston St
- 1315 Waverly St
- 1333 Yale St
- 1425 Tulane St
- 1335 Yale St
- 1245 Waverly St
- 1223 Waverly St
- 1310 Nicholson St
- 1118 Tulane St
- 1124 Ashland St
- 1439 Yale St
- 1505 Tulane St
- 523 W 15th St
- 1106 Tulane St
- 1227 Nicholson St
- 1327 Rutland St
- 1339 Rutland St
- 1323 Rutland St
- 1341 Rutland St
- 1326 Tulane St
- 1332 Tulane St
- 1319 Rutland St
- 1324 Tulane St
- 1322 Tulane St
- 1342 Tulane St
- 1343 Rutland St
- 1326 Rutland St
- 1317 Rutland St
- 1328 Rutland St
- 1324 Rutland St
- 414 W 14th St
- 1318 Tulane St
- 1342 Rutland St Unit 103
- 1342 Rutland St Unit 203
- 1342 Rutland St Unit 202