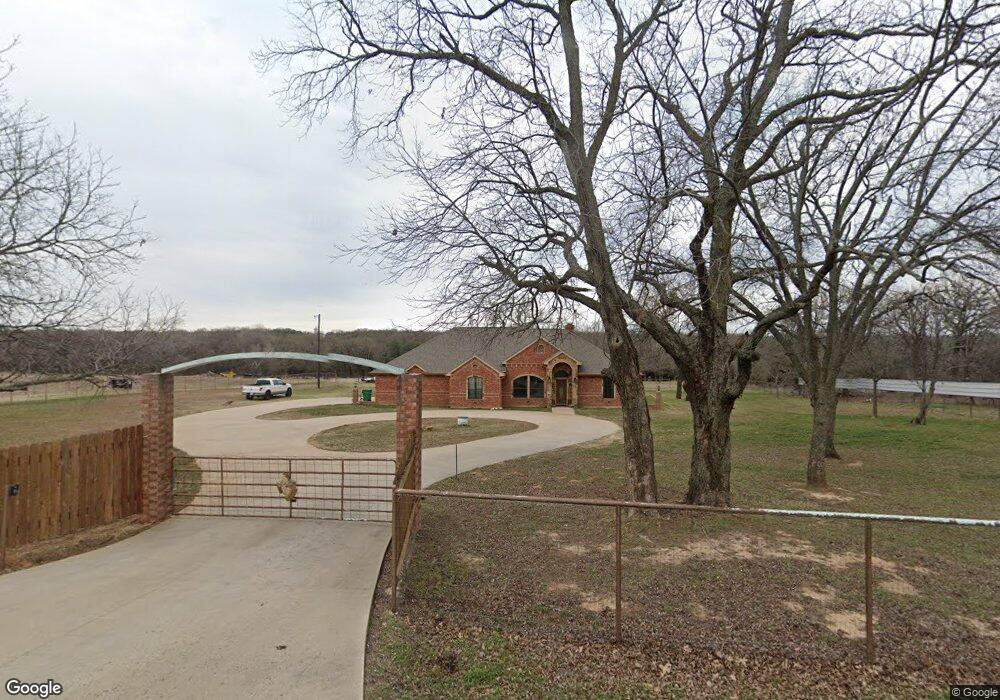
1333 W Dry Creek Rd Poolville, TX 76487
Estimated Value: $471,474 - $690,000
3
Beds
3
Baths
2,330
Sq Ft
$247/Sq Ft
Est. Value
About This Home
This home is located at 1333 W Dry Creek Rd, Poolville, TX 76487 and is currently estimated at $574,369, approximately $246 per square foot. 1333 W Dry Creek Rd is a home located in Parker County with nearby schools including Peaster Elementary School, Peaster Middle School, and Peaster High School.
Ownership History
Date
Name
Owned For
Owner Type
Purchase Details
Closed on
May 8, 2012
Sold by
Thompson David and Thompson Bonnie
Bought by
Leverton Shannon D
Current Estimated Value
Home Financials for this Owner
Home Financials are based on the most recent Mortgage that was taken out on this home.
Original Mortgage
$258,282
Outstanding Balance
$178,699
Interest Rate
3.87%
Mortgage Type
FHA
Estimated Equity
$395,670
Purchase Details
Closed on
Aug 26, 2005
Sold by
Hull Ed and Hull Frankie
Bought by
Leverton Shannon D
Purchase Details
Closed on
May 19, 2004
Sold by
Meade Donna Bullon
Bought by
Leverton Shannon D
Purchase Details
Closed on
Nov 3, 2003
Sold by
Hopkins Michael
Bought by
Leverton Shannon D
Purchase Details
Closed on
Mar 25, 2003
Sold by
Beeler Kathy and Debullon Donna De
Bought by
Leverton Shannon D
Purchase Details
Closed on
Feb 12, 1999
Bought by
Leverton Shannon D
Purchase Details
Closed on
Feb 18, 1981
Bought by
Leverton Shannon D
Create a Home Valuation Report for This Property
The Home Valuation Report is an in-depth analysis detailing your home's value as well as a comparison with similar homes in the area
Home Values in the Area
Average Home Value in this Area
Purchase History
| Date | Buyer | Sale Price | Title Company |
|---|---|---|---|
| Leverton Shannon D | -- | None Available | |
| Leverton Shannon D | -- | -- | |
| Thompson David | -- | None Available | |
| Leverton Shannon D | -- | -- | |
| Leverton Shannon D | -- | -- | |
| Leverton Shannon D | -- | -- | |
| Leverton Shannon D | -- | -- | |
| Leverton Shannon D | -- | -- |
Source: Public Records
Mortgage History
| Date | Status | Borrower | Loan Amount |
|---|---|---|---|
| Open | Leverton Shannon D | $258,282 |
Source: Public Records
Tax History Compared to Growth
Tax History
| Year | Tax Paid | Tax Assessment Tax Assessment Total Assessment is a certain percentage of the fair market value that is determined by local assessors to be the total taxable value of land and additions on the property. | Land | Improvement |
|---|---|---|---|---|
| 2025 | $4,529 | $360,082 | -- | -- |
| 2024 | $4,529 | $327,347 | $28,390 | $298,957 |
| 2023 | $4,529 | $313,115 | $0 | $0 |
| 2022 | $5,677 | $284,650 | $17,000 | $267,650 |
| 2021 | $5,722 | $284,650 | $17,000 | $267,650 |
| 2020 | $5,509 | $268,600 | $13,570 | $255,030 |
| 2019 | $5,720 | $268,600 | $13,570 | $255,030 |
| 2018 | $5,216 | $241,330 | $10,000 | $231,330 |
| 2017 | $6,082 | $295,010 | $50,000 | $245,010 |
| 2016 | $5,482 | $254,920 | $50,000 | $204,920 |
| 2015 | $5,055 | $254,920 | $50,000 | $204,920 |
| 2014 | $4,999 | $242,980 | $50,000 | $192,980 |
Source: Public Records
Map
Nearby Homes
- 112 Dubois Rd
- 1017 Vh Ranch Rd
- 8108 EP Floor Plan at Dry Creek East
- 8137 Floor Plan at Dry Creek East
- 8125 Floor Plan at Dry Creek East
- 8121 Floor Plan at Dry Creek East
- 8113 Floor Plan at Dry Creek East
- 8136 Floor Plan at Dry Creek East
- 8126 Floor Plan at Dry Creek East
- 8130 Floor Plan at Dry Creek East
- 8135 Floor Plan at Dry Creek East
- 1065 Vh Ranch Rd
- 1000 Vh Ranch Rd
- 681 Red Top Rd
- 1005 Cheyenne Rd
- 12125 Fm 920
- 1635 Russell Bend Rd
- 114 Redtail Ct
- 1631 Russell Bend Rd
- 242 Bishop Dr
- 1190 W Dry Creek Rd
- 1444 W Dry Creek Rd
- 1200 W Dry Creek Rd
- 1021 W Dry Creek Rd
- 201 Melton Ln
- 255 Melton Ln
- 1326 W Dry Creek Rd
- 301 Melton Ln
- 1320 W Dry Creek Rd
- 100 Dubois Rd
- Lot 14 Dubois Rd
- 104 Dubois Rd
- 101 Dubois Rd
- 450 Melton Ln
- 12 Lot Dubois Rd
- 1415 W Dry Creek Rd
- 1437 W Dry Creek Rd
- 1415 W Dry Creek Rd
- Lot 12 Dubois Rd
- 0 W Dry Creek Rd