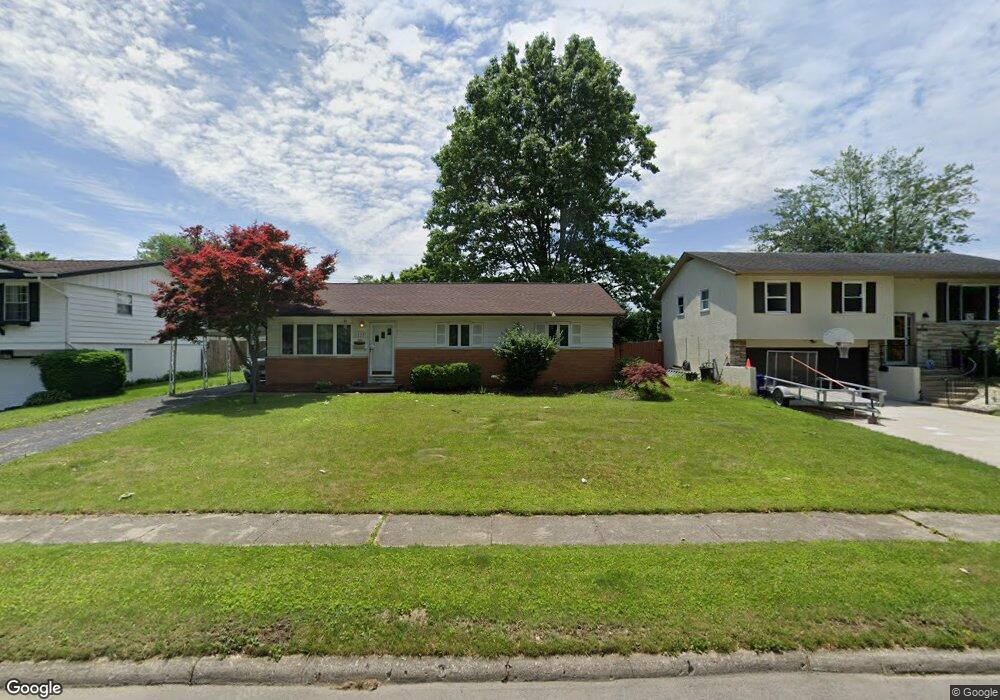
1333 Whitby Square S Columbus, OH 43229
Devonshire NeighborhoodEstimated Value: $196,000 - $283,000
3
Beds
2
Baths
1,260
Sq Ft
$194/Sq Ft
Est. Value
About This Home
This home is located at 1333 Whitby Square S, Columbus, OH 43229 and is currently estimated at $243,923, approximately $193 per square foot. 1333 Whitby Square S is a home located in Franklin County with nearby schools including Devonshire Alternative Elementary School, Woodward Park Middle School, and Beechcroft High School.
Ownership History
Date
Name
Owned For
Owner Type
Purchase Details
Closed on
Dec 13, 2005
Sold by
White Christopher W and White Jennifer L
Bought by
Scott Steven L and Scott Christina B
Current Estimated Value
Home Financials for this Owner
Home Financials are based on the most recent Mortgage that was taken out on this home.
Original Mortgage
$120,000
Outstanding Balance
$67,420
Interest Rate
6.36%
Mortgage Type
Fannie Mae Freddie Mac
Estimated Equity
$176,503
Purchase Details
Closed on
Apr 25, 1995
Sold by
Bowsher Dian Jean
Bought by
Shriver Christopher W White and Shriver Jennifer L
Home Financials for this Owner
Home Financials are based on the most recent Mortgage that was taken out on this home.
Original Mortgage
$76,278
Interest Rate
8.64%
Mortgage Type
FHA
Create a Home Valuation Report for This Property
The Home Valuation Report is an in-depth analysis detailing your home's value as well as a comparison with similar homes in the area
Home Values in the Area
Average Home Value in this Area
Purchase History
| Date | Buyer | Sale Price | Title Company |
|---|---|---|---|
| Scott Steven L | $120,000 | -- | |
| Shriver Christopher W White | $78,000 | -- |
Source: Public Records
Mortgage History
| Date | Status | Borrower | Loan Amount |
|---|---|---|---|
| Open | Scott Steven L | $120,000 | |
| Closed | Shriver Christopher W White | $76,278 |
Source: Public Records
Tax History Compared to Growth
Tax History
| Year | Tax Paid | Tax Assessment Tax Assessment Total Assessment is a certain percentage of the fair market value that is determined by local assessors to be the total taxable value of land and additions on the property. | Land | Improvement |
|---|---|---|---|---|
| 2024 | $2,754 | $71,160 | $16,910 | $54,250 |
| 2023 | $2,747 | $71,155 | $16,905 | $54,250 |
| 2022 | $1,790 | $43,260 | $12,180 | $31,080 |
| 2021 | $1,793 | $43,260 | $12,180 | $31,080 |
| 2020 | $1,795 | $43,260 | $12,180 | $31,080 |
| 2019 | $1,561 | $34,480 | $9,730 | $24,750 |
| 2018 | $1,387 | $34,480 | $9,730 | $24,750 |
| 2017 | $1,560 | $34,480 | $9,730 | $24,750 |
| 2016 | $1,341 | $28,990 | $7,390 | $21,600 |
| 2015 | $1,217 | $28,990 | $7,390 | $21,600 |
| 2014 | $1,220 | $28,990 | $7,390 | $21,600 |
| 2013 | $697 | $32,200 | $8,190 | $24,010 |
Source: Public Records
Map
Nearby Homes
- 1288 Oakfield Dr N
- 5990 Ambleside Dr
- 6189 Northgap Dr
- 1390 E Dublin Granville Rd
- 6035 Karl Rd
- 1171 Newbury Dr
- 6211 Parkdale Dr
- 1549 Alpine Dr
- 1268 Kildale Ct
- 6407 Faircrest Rd
- 6342 Bellmeadow Dr
- 1492 Cottonwood Dr
- 6458 Faircrest Rd
- 1409 Bosworth Place
- 1752 Pine Tree St S Unit H
- 1743 Pine Tree St N Unit A
- 1421 Bosworth Place
- 1687 Brookfield Square S
- 1294 Clydesdale Ct
- 6407 Skywae Dr
- 1327 Whitby Square S
- 1339 Whitby Square S
- 1347 Whitby Square S
- 1340 Whitby Square S
- 1332 Tiverton Square N
- 1340 Tiverton Square N
- 6121 Whitby Square W
- 6136 Whitby Square W
- 6093 Tiverton Square W
- 1348 Tiverton Square N
- 6125 Whitby Square W
- 1359 Whitby Square S
- 1348 Whitby Square S
- 1354 Tiverton Square N
- 6131 Whitby Square W
- 6087 Tiverton Square W
- 1360 Whitby Square S
- 6135 Whitby Square W
- 1366 Tiverton Square N
- 6148 Whitby Square W