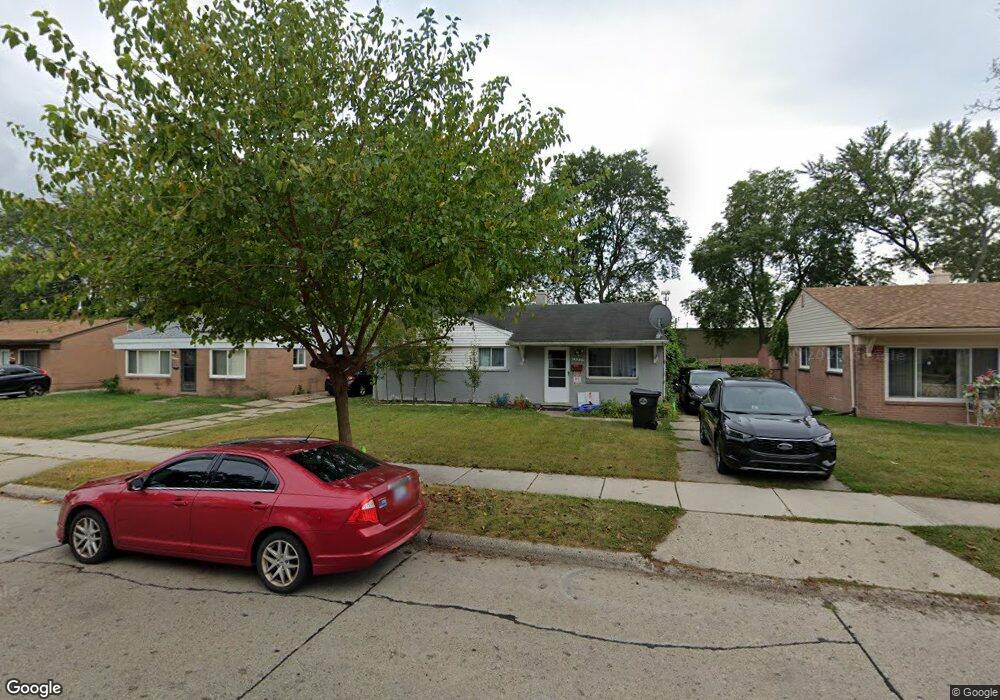
13331 Albany St Unit Bldg-Unit Oak Park, MI 48237
Estimated Value: $162,000 - $168,000
3
Beds
1
Bath
1,017
Sq Ft
$162/Sq Ft
Est. Value
About This Home
This home is located at 13331 Albany St Unit Bldg-Unit, Oak Park, MI 48237 and is currently estimated at $164,545, approximately $161 per square foot. 13331 Albany St Unit Bldg-Unit is a home located in Oakland County with nearby schools including Key Elementary School and Oholei Yosef Yitzchak Lubavitch.
Ownership History
Date
Name
Owned For
Owner Type
Purchase Details
Closed on
Jan 18, 2018
Sold by
Luserne Llc
Bought by
Khameesi Ehsan Al and Khameesi Azhar Al
Current Estimated Value
Home Financials for this Owner
Home Financials are based on the most recent Mortgage that was taken out on this home.
Original Mortgage
$50,925
Outstanding Balance
$42,975
Interest Rate
3.94%
Mortgage Type
New Conventional
Estimated Equity
$121,570
Purchase Details
Closed on
Nov 5, 2015
Sold by
United Impex Llc
Bought by
Luserne Llc
Purchase Details
Closed on
Dec 21, 2012
Sold by
Habib Sarmad and Habib Souad
Bought by
United Impex Llc
Purchase Details
Closed on
Mar 18, 1998
Sold by
Habib Nashwan J
Bought by
Sarmad Habib
Purchase Details
Closed on
Nov 27, 1995
Sold by
Bahoura Toma
Bought by
Habib Nashwan
Home Financials for this Owner
Home Financials are based on the most recent Mortgage that was taken out on this home.
Original Mortgage
$32,000
Interest Rate
7.52%
Create a Home Valuation Report for This Property
The Home Valuation Report is an in-depth analysis detailing your home's value as well as a comparison with similar homes in the area
Home Values in the Area
Average Home Value in this Area
Purchase History
| Date | Buyer | Sale Price | Title Company |
|---|---|---|---|
| Khameesi Ehsan Al | $52,500 | None Available | |
| Luserne Llc | $37,500 | Progressive Title Agency | |
| United Impex Llc | $23,500 | Title Plus Llc | |
| Sarmad Habib | -- | -- | |
| Habib Nashwan | $40,000 | -- |
Source: Public Records
Mortgage History
| Date | Status | Borrower | Loan Amount |
|---|---|---|---|
| Open | Khameesi Ehsan Al | $50,925 | |
| Previous Owner | Habib Nashwan | $32,000 |
Source: Public Records
Tax History Compared to Growth
Tax History
| Year | Tax Paid | Tax Assessment Tax Assessment Total Assessment is a certain percentage of the fair market value that is determined by local assessors to be the total taxable value of land and additions on the property. | Land | Improvement |
|---|---|---|---|---|
| 2024 | $1,764 | $60,900 | $9,500 | $51,400 |
| 2023 | $1,692 | $50,500 | $7,400 | $43,100 |
| 2022 | $1,628 | $39,900 | $6,400 | $33,500 |
| 2021 | $1,622 | $34,800 | $2,900 | $31,900 |
| 2020 | $1,572 | $28,900 | $2,900 | $26,000 |
| 2018 | $999 | $20,300 | $0 | $0 |
| 2015 | -- | $15,000 | $0 | $0 |
| 2014 | -- | $13,300 | $0 | $0 |
| 2011 | -- | $22,200 | $0 | $0 |
Source: Public Records
Map
Nearby Homes
- 13341 Albany St
- 22000 Blackstone St
- 22030 Dante St
- 22100 Dante St
- 22100 Dante St Unit bldg F unit 114
- 22051 Fern St
- 13333 W 9 Mile Rd
- 21901 Sloman St
- 22020 Sloman St
- 21630 Westhampton St
- 22191 Ridgedale St
- 21430 Ridgedale St
- 12761 Saratoga St
- 13941 Pearson St
- 21710 Parklawn St
- 13301 Kenwood St
- 21701 Parklawn St
- 21460 Parklawn St
- 21661 Cloverlawn St
- 10760 Troy St
- 13331 Albany St
- 13351 Albany St
- 13321 Albany St
- 13311 Albany St
- 21900 Dante St
- 13301 Albany St
- 13401 Albany St
- 13411 Albany St
- 21901 Vale St
- 21910 Dante St Unit Bldg-Unit
- 21910 Dante St
- 21901 Dante St
- 21911 Vale St
- 13241 Albany St
- 21911 Dante St
- 21920 Dante St
- 13380 Capital St
- 13231 Albany St
- 21921 Vale St
- 21921 Dante St