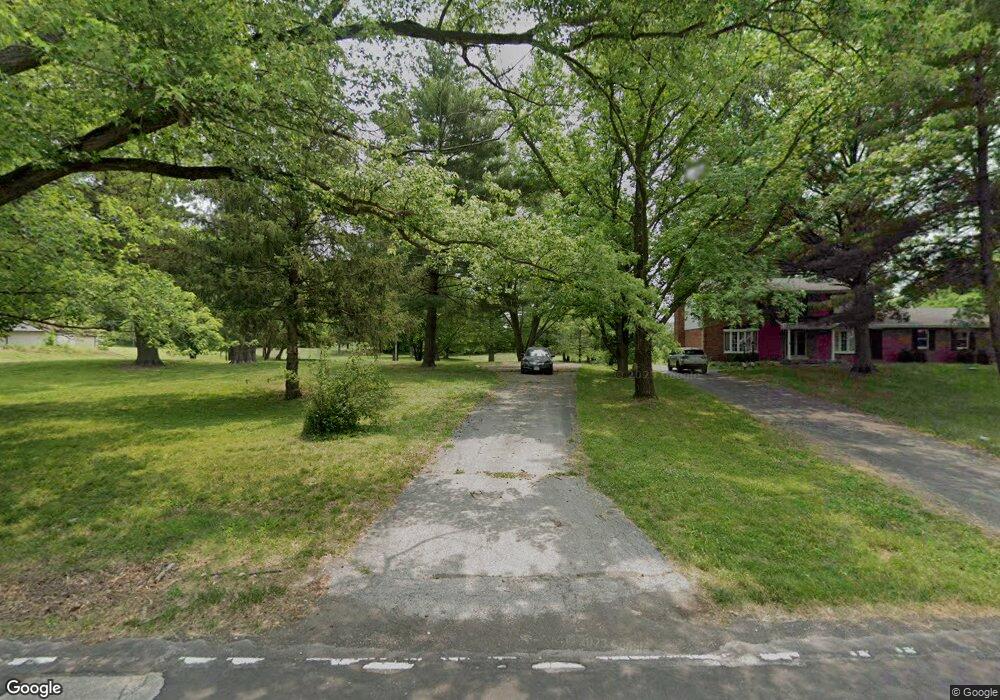
13336 W Watson Rd Saint Louis, MO 63127
Estimated Value: $105,725 - $713,000
3
Beds
2
Baths
1,150
Sq Ft
$338/Sq Ft
Est. Value
About This Home
This home is located at 13336 W Watson Rd, Saint Louis, MO 63127 and is currently estimated at $389,181, approximately $338 per square foot. 13336 W Watson Rd is a home located in St. Louis County with nearby schools including Concord Elementary School, Sperreng Middle School, and Lindbergh High School.
Ownership History
Date
Name
Owned For
Owner Type
Purchase Details
Closed on
Sep 14, 2021
Sold by
Anatt Pattichot
Bought by
Wmac 2014 Llc
Current Estimated Value
Purchase Details
Closed on
Oct 17, 2006
Sold by
Meine Todd L
Bought by
Friess Douglas E and Friess Jennifer M
Home Financials for this Owner
Home Financials are based on the most recent Mortgage that was taken out on this home.
Original Mortgage
$165,600
Interest Rate
6.46%
Mortgage Type
Unknown
Purchase Details
Closed on
Jun 28, 2001
Sold by
Wiegand Michael E and Wiegand Amanda S
Bought by
Meine Todd L
Purchase Details
Closed on
Oct 26, 1998
Sold by
Dairaghi Charles A
Bought by
Wiegand Michael E and Wiegand Amanda E
Home Financials for this Owner
Home Financials are based on the most recent Mortgage that was taken out on this home.
Original Mortgage
$119,200
Interest Rate
6.57%
Create a Home Valuation Report for This Property
The Home Valuation Report is an in-depth analysis detailing your home's value as well as a comparison with similar homes in the area
Home Values in the Area
Average Home Value in this Area
Purchase History
| Date | Buyer | Sale Price | Title Company |
|---|---|---|---|
| Wmac 2014 Llc | -- | None Listed On Document | |
| Friess Douglas E | $207,000 | None Available | |
| Meine Todd L | $135,000 | -- | |
| Wiegand Michael E | $125,500 | -- |
Source: Public Records
Mortgage History
| Date | Status | Borrower | Loan Amount |
|---|---|---|---|
| Previous Owner | Friess Douglas E | $165,600 | |
| Previous Owner | Wiegand Michael E | $119,200 |
Source: Public Records
Tax History Compared to Growth
Tax History
| Year | Tax Paid | Tax Assessment Tax Assessment Total Assessment is a certain percentage of the fair market value that is determined by local assessors to be the total taxable value of land and additions on the property. | Land | Improvement |
|---|---|---|---|---|
| 2025 | $1,970 | $36,710 | $36,710 | -- |
| 2024 | $1,970 | $27,550 | $27,550 | -- |
| 2023 | $1,966 | $27,550 | $27,550 | $0 |
| 2022 | $2,044 | $27,550 | $27,550 | $0 |
| 2021 | $2,034 | $27,550 | $27,550 | $0 |
| 2020 | $1,486 | $19,440 | $19,440 | $0 |
| 2019 | $1,482 | $19,440 | $19,440 | $0 |
| 2018 | $1,018 | $12,480 | $12,480 | $0 |
| 2017 | $1,007 | $12,480 | $12,480 | $0 |
| 2016 | $2,632 | $32,640 | $12,480 | $20,160 |
| 2015 | $2,597 | $32,640 | $12,480 | $20,160 |
| 2014 | $2,479 | $30,720 | $5,320 | $25,400 |
Source: Public Records
Map
Nearby Homes
- 13310 W Watson Rd
- 12830 Weber Hill Rd
- 13013 Stone Castle Ct
- 13025 Stone Castle Ct
- 13355 Maple Dr
- 11226 Pointe Ct
- 12795 Nanell Ln
- 12817 Pointe Dr
- 12981 Baalbek Dr
- 515 Main St
- 735 River Hills Dr
- 0 Unknown Unit MIS25071866
- 0 Unknown Unit MIS25071884
- 546 Gravois Rd
- 15 Ashgate Ct
- 9129 Rott Rd
- 54 Sennawood Dr
- 12224 Bird Haven Ln
- 9320 Lincoln Dr
- 10755 Kennerly Rd
- 13328 W Watson Rd
- 13320 W Watson Rd
- 13314 W Watson Rd
- 13300 W Watson Rd
- 16 Flagstick Ct
- 12 Flagstick Ct
- 12887 Edelen Ln
- 3 Edelen Ln
- 12887 Edelen (Lot 3) Ln
- 8 Flagstick Ct
- 12890 Edelen Ln
- 12890 Edelen (Lot 2) Ln
- 4 Flagstick Ct
- 13246 W Watson Rd
- 15 Flagstick Ct
- 11 Flagstone Terrace
- 24 Flagstick Ct
- 7 Flagstick Ct
- 1 Edelen Ln
- 3 Flagstick Ct