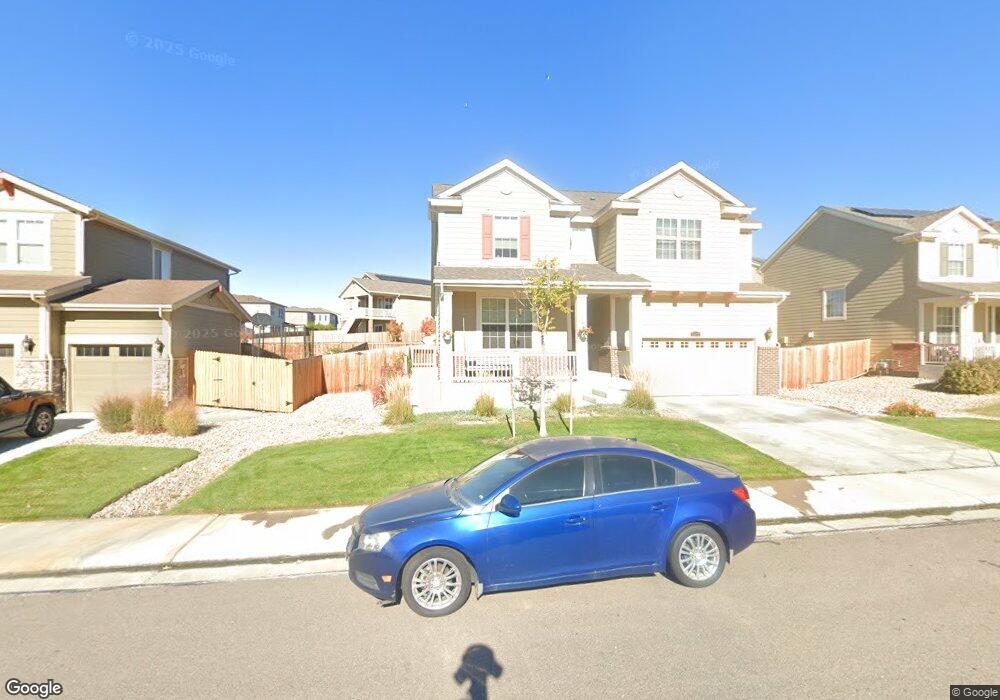
13337 Olive St Thornton, CO 80602
Estimated Value: $657,000 - $737,000
4
Beds
4
Baths
2,691
Sq Ft
$256/Sq Ft
Est. Value
About This Home
This home is located at 13337 Olive St, Thornton, CO 80602 and is currently estimated at $689,634, approximately $256 per square foot. 13337 Olive St is a home located in Adams County with nearby schools including West Ridge Elementary School, Rodger Quist Middle School, and Riverdale Ridge High School.
Ownership History
Date
Name
Owned For
Owner Type
Purchase Details
Closed on
Nov 22, 2025
Sold by
Uddin Md Imam and Noor Fariha
Bought by
Md Imam Uddin And Fariha Noor Revocable Livin and Uddin
Current Estimated Value
Purchase Details
Closed on
Oct 15, 2021
Sold by
Zillow Homes Property Trusts
Bought by
Uddin Md Imam and Noor Fariha
Home Financials for this Owner
Home Financials are based on the most recent Mortgage that was taken out on this home.
Original Mortgage
$537,810
Interest Rate
2.8%
Mortgage Type
New Conventional
Purchase Details
Closed on
Jun 14, 2021
Sold by
Cato Cordell
Bought by
Zillow Homes Prperty Trusts
Purchase Details
Closed on
Apr 6, 2017
Sold by
Lennar Colorado Llc
Bought by
Catio Cardell
Home Financials for this Owner
Home Financials are based on the most recent Mortgage that was taken out on this home.
Original Mortgage
$417,000
Interest Rate
4.08%
Mortgage Type
New Conventional
Create a Home Valuation Report for This Property
The Home Valuation Report is an in-depth analysis detailing your home's value as well as a comparison with similar homes in the area
Purchase History
| Date | Buyer | Sale Price | Title Company |
|---|---|---|---|
| Md Imam Uddin And Fariha Noor Revocable Livin | -- | None Listed On Document | |
| Uddin Md Imam | $591,000 | Zillow Closing Services | |
| Zillow Homes Prperty Trusts | $662,900 | None Available | |
| Catio Cardell | $465,200 | North American Title Co |
Source: Public Records
Mortgage History
| Date | Status | Borrower | Loan Amount |
|---|---|---|---|
| Previous Owner | Uddin Md Imam | $537,810 | |
| Previous Owner | Catio Cardell | $417,000 |
Source: Public Records
Tax History
| Year | Tax Paid | Tax Assessment Tax Assessment Total Assessment is a certain percentage of the fair market value that is determined by local assessors to be the total taxable value of land and additions on the property. | Land | Improvement |
|---|---|---|---|---|
| 2025 | $8,058 | $48,820 | $8,500 | $40,320 |
| 2024 | $8,058 | $44,870 | $7,810 | $37,060 |
| 2023 | $7,962 | $50,330 | $7,440 | $42,890 |
| 2022 | $6,214 | $36,000 | $6,600 | $29,400 |
| 2021 | $6,048 | $36,000 | $6,600 | $29,400 |
| 2020 | $6,049 | $37,020 | $6,790 | $30,230 |
| 2019 | $6,171 | $37,020 | $6,790 | $30,230 |
| 2018 | $5,054 | $31,070 | $6,840 | $24,230 |
| 2017 | $1,833 | $11,280 | $11,280 | $0 |
| 2016 | $184 | $1,220 | $1,220 | $0 |
| 2015 | $184 | $1,220 | $1,220 | $0 |
| 2014 | -- | $10 | $10 | $0 |
Source: Public Records
Map
Nearby Homes
- 13336 Olive St
- 13380 Oneida St
- 6883 E 132nd Place
- 13455 Magnolia Ct
- 12814 Newport Way
- 8194 E 132nd Place
- 12901 Spruce St
- 13022 Tamarac Place
- 12891 Spruce St
- 13200 Uinta St
- 13190 Kearney St
- 13427 Krameria St
- 13407 Valentia St
- 7875 E 136th Dr
- 13664 Linden Ct
- 8222 E 129th Place
- 12876 Jasmine St Unit E
- 12754 Leyden St Unit E
- 12884 Jasmine St Unit C
- 12822 Jasmine St Unit E
- 13341 Olive St
- 13333 Olive St
- 13348 Oneida St
- 13329 Olive St
- 13345 Olive St
- 13344 Oneida St
- 13332 Olive St
- 6957 E 133rd Place
- 13340 Olive St
- 13344 Olive St
- 13349 Olive St
- 13328 Olive St
- 13328 Olive St
- 6947 E 133rd Place
- 13340 Oneida St
- 13335 Olive Way
- 13360 Oneida St
- 13348 Olive St
- 13339 Olive Way
- 13364 Oneida St
Your Personal Tour Guide
Ask me questions while you tour the home.